
Hello,

Our comprehensive NCAA football coverage includes betting tips, odds, and articles for every aspect of college football. From today's matchups and college football odds to betting splits, VSiN is your one-stop destination for the latest college football betting information. Improve your betting experience and stay ahead of the game with in-depth analysis and expert picks for the best college football bets. Dive into the headlines below or check out the menu above for the best college football news!
January 18, 2026
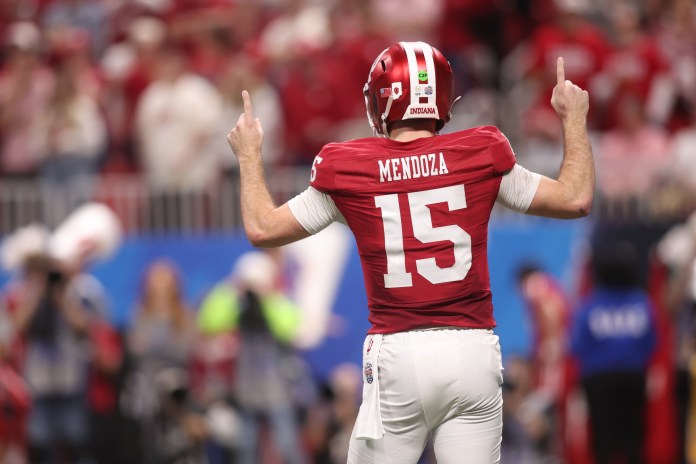
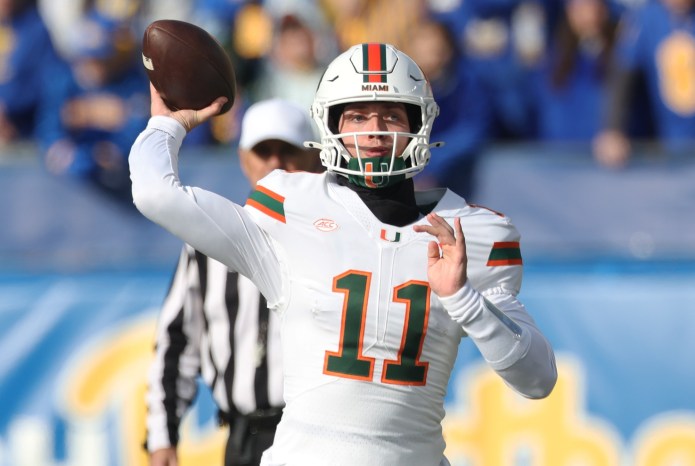
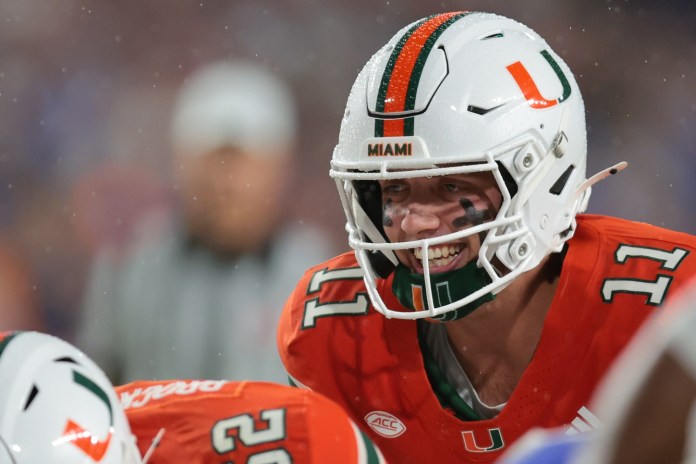
Miami vs. Indiana One of the biggest draws to the expanded 12-team College Football Playoff is that it allows more teams to have a chance...
January 18, 2026
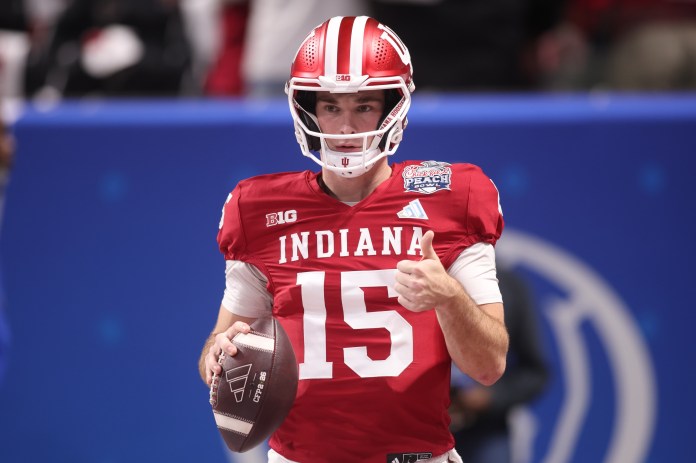
VSiN Director of Analytics Steve Makinen put together his College Football Playoff Analytics Report for the title game. Using those stats and trends and more,...
January 18, 2026
Tuley’s Takes – College Football Playoff Final Best Bets, Picks and Predictions: We’re excited in the Tuley’s Takes home office for the CFB Playoff Championship...
January 18, 2026
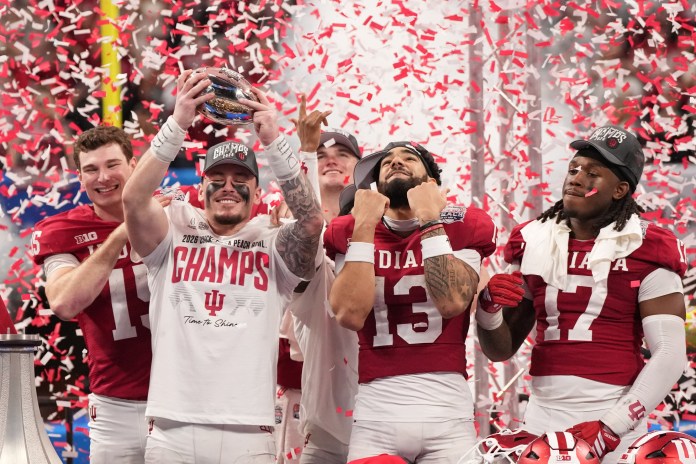
College Football Playoff National Championship Best Bets, Predictions and Picks from Wes Reynolds: The Indiana Hoosiers began the season at 100/1 on BetMGM to win...

January 18, 2026
College Football Playoff National Championship Predictions The time has come for college football’s ultimate prize to be awarded on Monday night, and the Miami Hurricanes...
January 14, 2026
Bowl Game This will be the home for all of our College Football Bowl Game content, including a schedule, previews and predictions for each game,...
January 13, 2026
Some are already calling it the “Curt Cignatty”, as his juggernaut team is the favorite for the CFP National Championship Game in Miami Gardens, FL...
College Football, The VSiN Daily
January 10, 2026
Indiana will meet Miami for the CFP title on Monday, Jan. 19 on the Hurricanes’ home turf. The line is IU -7.5, which is understandable...
January 9, 2026
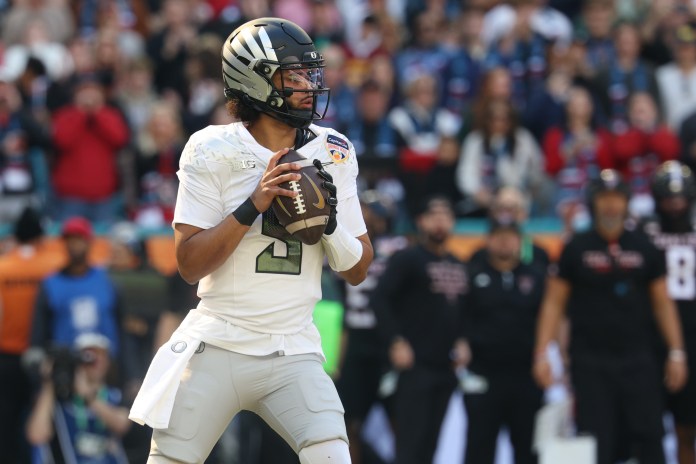
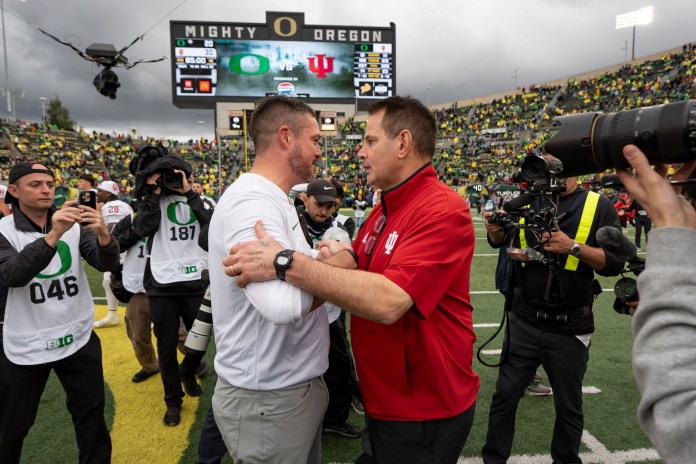
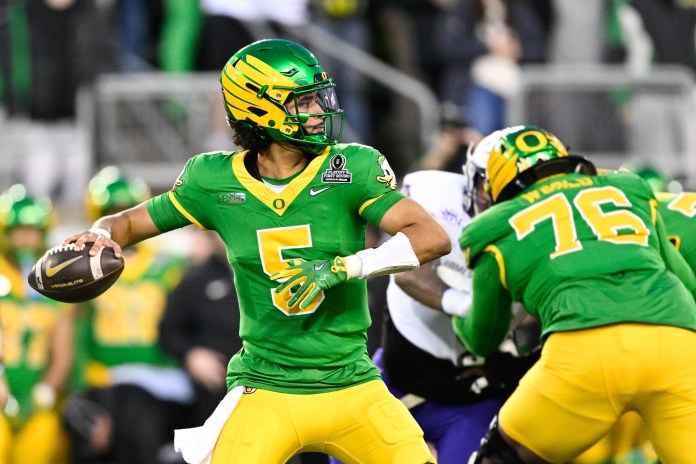
The College Football Playoff semifinals continue tonight with a primetime showdown between Oregon and Indiana. Let’s examine where smart money is leaning for tonight’s matchup...
College Football, The VSiN Daily
January 8, 2026
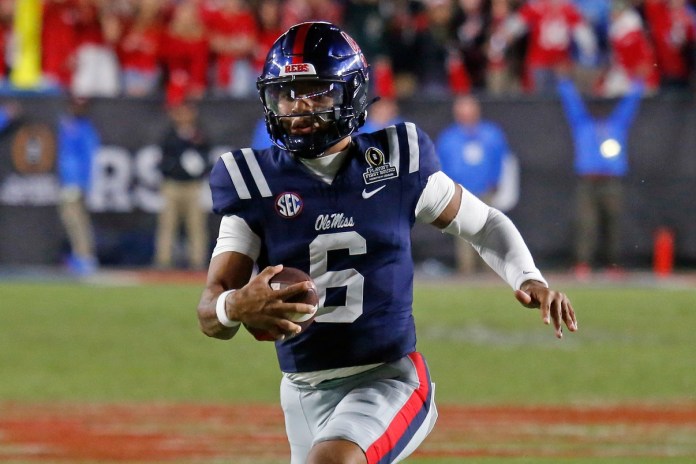
Miami advanced to the CFP championship game on its home turf by rallying to beat Ole Miss 31-27 on Thursday night. The Hurricanes covered the...
January 8, 2026
College Football Playoff Semifinals Best Bets, Predictions and Picks from Matt Youmans Here are my best bets for this week’s CFP Semifinals: Miami (FL) (-3.5)...
January 8, 2026
Oregon vs. Indiana On Friday, January 9, the Oregon Ducks and Indiana Hoosiers will battle for a spot in the College Football Playoff National Championship...