Evaluating Current College Football Strength Ratings for Week 4
This is a key week for me in the college football season as far as analytics is concerned. Up until this point each season, I have relied on transitional data as the basis of my handicapping, essentially using adjustments I’ve made for each team based on changes from last year and what I’ve taken in for Weeks 0-3. This period is also when I relied heavily on my Stability System stuff, which will now be shelved again until next season. Speaking of which, it was a reasonably good ending for the stability angles, as the main one was 8-5-1 ATS this past weekend. The fading of new defensive coordinators also finished 13-10 ATS, while the 17+ starters system went 3-3 ATS to finish 11-5 for the season. All that aside, the main purpose of this article is to share the change you’ll notice across all of my College Football Strength Ratings.
After this past week’s games ended, I took the time to do a full data update in college football, taking into account only this season’s games, and you should notice some massive differences on my MAKINEN CFB POWER RATINGS PAGE. Up until now, as I mentioned earlier, I’ve used the first few weeks to adjust teams’ numbers from last season based on what I’ve seen. The new numbers are quite revealing, and I’d like to share them with readers, pointing out teams that may be better or worse than they appear. I’ve also updated the strength-of-schedule numbers so you can see for yourself which teams have played the toughest and easiest schedules to date. Let’s get right into it.
Power Ratings
My Power Ratings aren’t much different from anything you see out in the betting market. They are simply a numerical value given to each team, indicating how they compare to all the other teams. Each ratings point theoretically represents one point on a scoreboard, and you can create a theoretical neutral game line between two teams by simply comparing the numbers. My current power ratings find Georgia on top after three blowout wins to start the season. The Bulldogs have a PR of 70.5, which is an average figure for a top team by my standards. Only one other team is within 2 points of that top spot: Ohio State at 70. Texas (68), Indiana (68), Notre Dame (67.5), and Miami (67) round out the top six, with three of the four P4 conferences and an Independent represented. Five other teams have an SMPR of 60 or better. The closeness at the top sets up what could be a fantastic run to the CFP, since no team is truly dominant yet. If you’re wondering, the highest team on my POWER RATINGS from the Group of 6 is Boise State from the newly rebuilt Pac-12, 20.5 points below Georgia. The highest FCS team is Montana State, at 38. The lowest-rated Power 4 team is Boston College at 35, although the Eagles did beat Rutgers (37.5) in head-to-head play. The lowest Group of 6 team is Sacramento State, who is having a rough go of it at the FBS level in MAC, having already lost four times.
Effective Strength Ratings
The early part of the college football season can be difficult for many bettors, since most games through this point have been non-conference matchups, and it’s hard to weigh teams’ schedule strength against their raw stats to gauge overall strength. At this point, most Group of 6 teams have played tougher schedules against Power 4 foes, and vice versa, with only a few select premium non-conference and conference games sprinkled in. For instance, teams like Georgia and Indiana have beaten up on some inferior opponents so far, while those like Texas, Ohio State, LSU, Ole Miss, etc., have faced stiffer slates. But now with conference play starting in earnest, how will these teams stack up? Do the experts have their strength levels gauged properly? These are just some of the tough questions facing bettors right now.
Fortunately, I have statistical measures I use to calculate teams’ actual strength against the level of opponents they have played. These are called my EFFECTIVE STATS, and they’re similar to the popular DVOR ratings or the RPI numbers in college basketball. I use these Effective Stats to help determine my overall Power Ratings and the other key indicators.
After running the first few weeks of data, I found that Georgia is the highest-performing team against its schedule according to my Effective Strength Ratings. The Bulldogs boast an ESR or +46, which if you were to equate that to my power ratings scale, would be a 73, just 2.5 points more than their actual PR. For comparison’s sake, however, note that at this time a year ago, Oregon was #1 in this metric with a +53.4 rating, a full TD better than UGA currently. Next in line for the current ESR ratings is Ohio State at +45.2, followed by the team that beat OSU, Texas, at +44.4. All of these teams, plus Miami at #4 with +43.6 & #5 Alabama at +43.5, have performed theoretically better on the field than their PR’s, or even market perception, indicates. But not as much as I have become used to. Add Notre Dame, Utah, Mississippi State, LSU, and Florida to the rest of the top 10 in this key stat metric as teams perhaps underrated at this point.
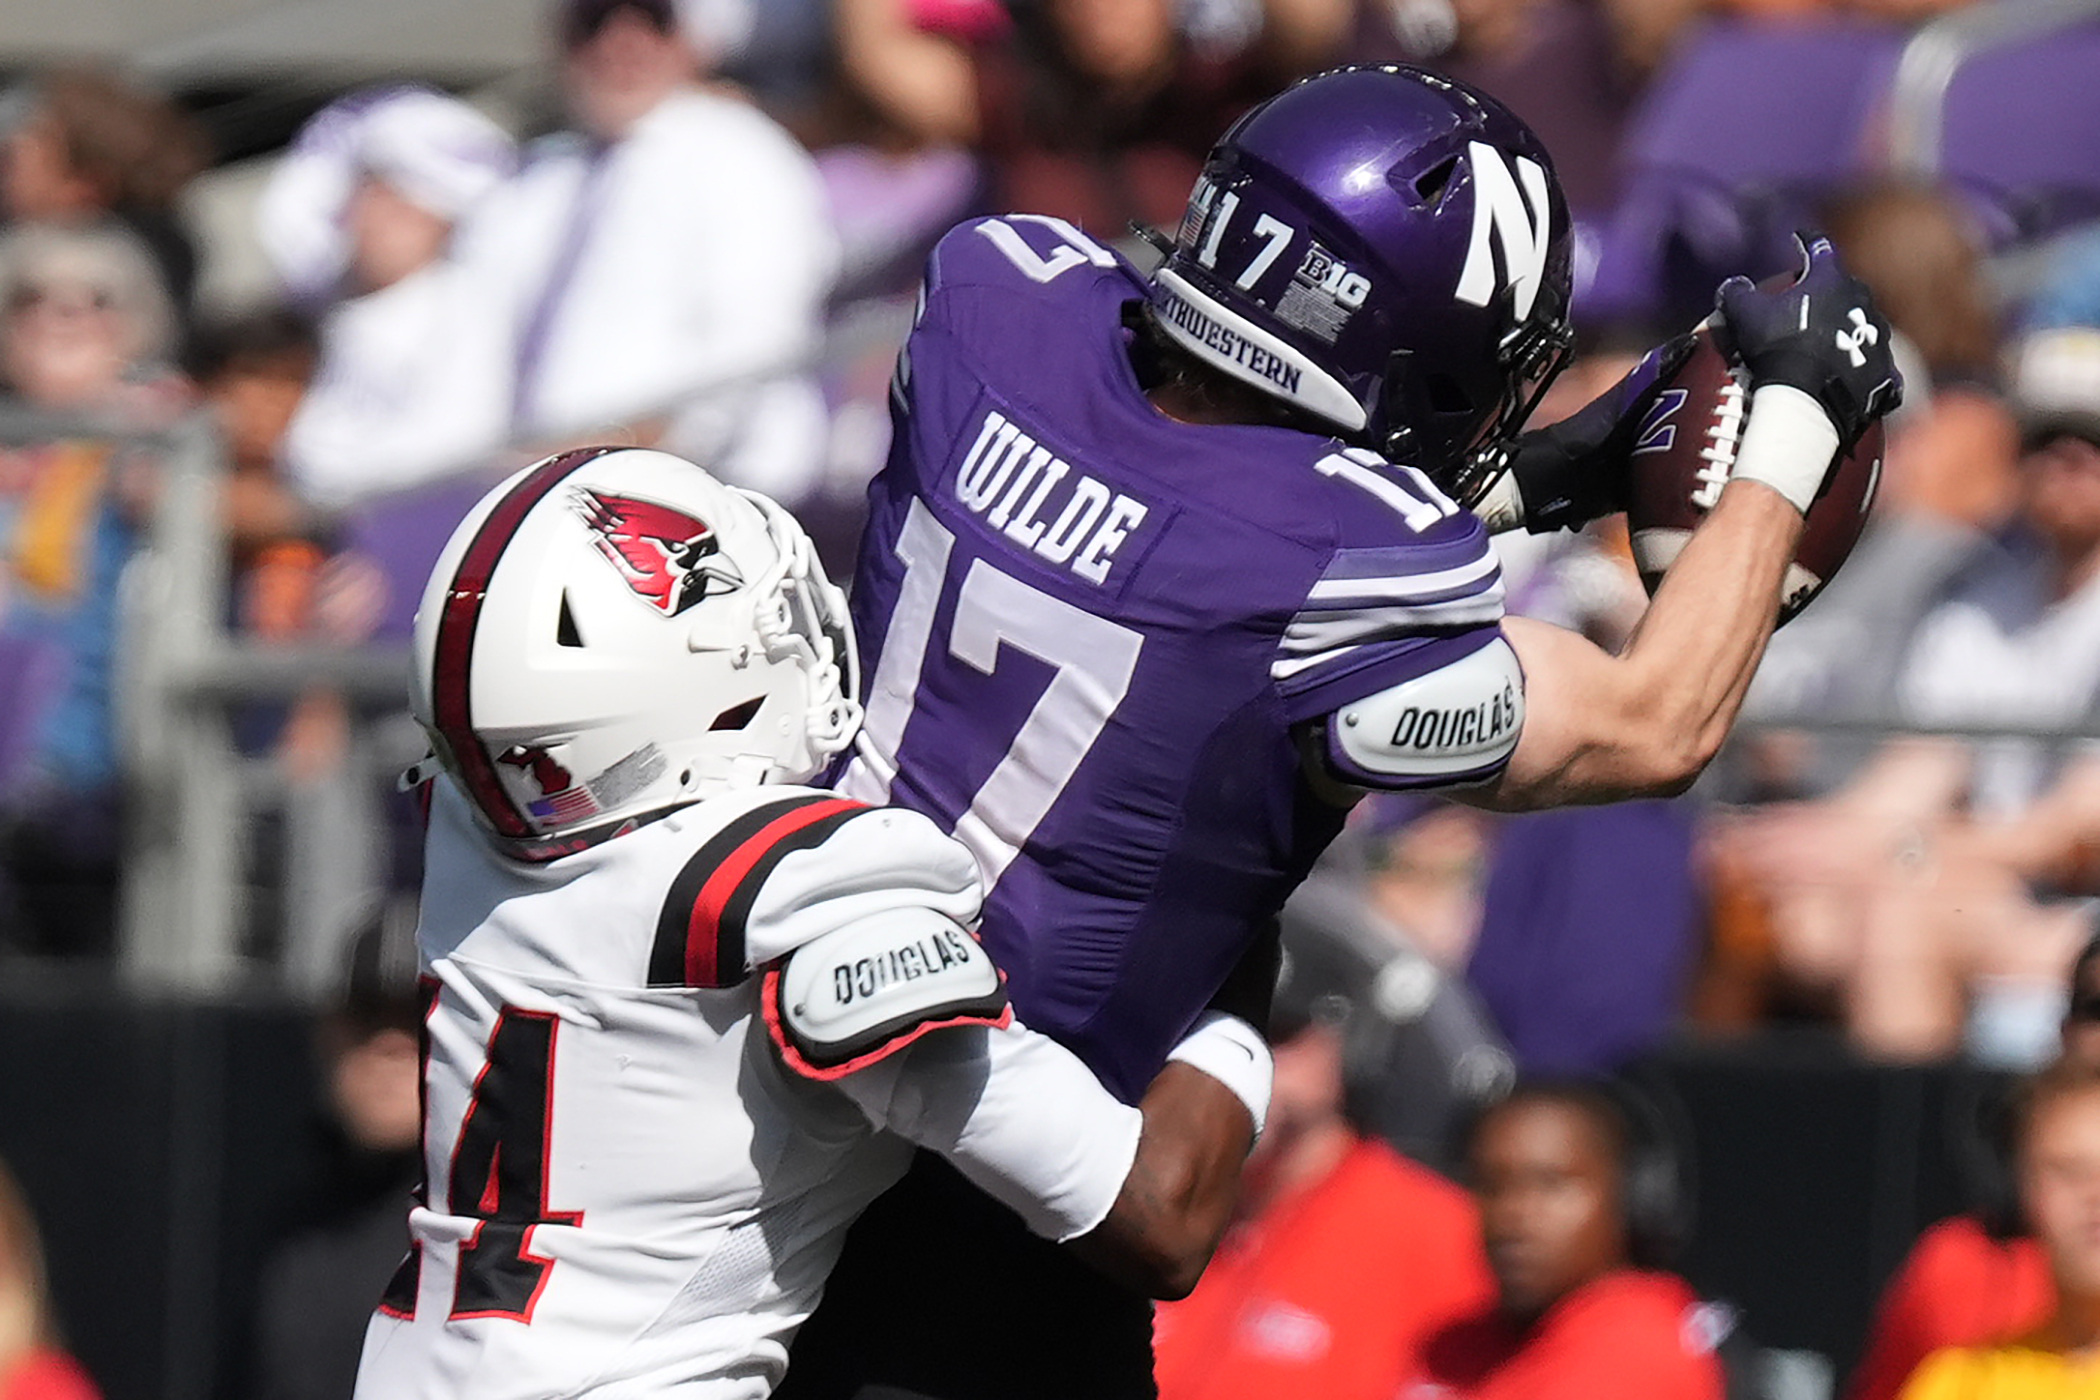
If you’re wondering about the team with the huge win from last Saturday night, Ole Miss has an ESR of +33 currently, which is equivalent to a 60 power rating, one below the Rebels’ actual PR. Looking deeper down the list for Effective Strength, you’ll find other current highly AP-ranked teams like Indiana (#13 in ESR) and BYU (#19 in ESR) playing perhaps below perception. This is something to watch. In fact, you can treat the ESR like a power-rating point: each point represents a point on a line. Specifically, the Hoosiers, with an ESR of +36.2, are just 2.1 points above Northwestern in that regard. Those two teams meet on Friday night, and the actual line shows IU -21. Is this a big miss by oddsmakers? Certainly not in the eyes of the betting public or the media, but in the analytics world, it most certainly is. We’ll see how things transpire in Bloomington.
Besides Northwestern, other teams that might be better than perceived right now according to the ESR’s are James Madison, Sam Houston State, New Mexico, and Mississippi State. On the opposite side of that argument, the top four teams that might not be as good as their perceived power ratings are Western Kentucky, Wyoming, Bowling Green, and Washington.
The highest-rated G5 team in Effective Strength right now is James Madison, with a value of +31.2. That is 27th in the country overall and better than the likes of Oklahoma, Duke, USC, and Michigan! At the FCS level, South Dakota State is back at its customary spot at the top, with a +12, 1.6 points better than Illinois State.
Bettors’ Ratings
My Bettors’ Ratings are a quantitative value derived from the lines teams have played at in recent games against their schedule strength. In other words, they are indicators for how the betting markets view the strengths of the teams. With that in mind, the team the market gauges as the top one in college football right now is Ohio State, the #1 ranked team at the outset of the season in the polls. This is not a surprise, as the Buckeyes lost to Texas in a crazy comeback and have two massive other blowout wins over MAC teams on their resume. The OSU BR of -40.3 indicates that they would be a 40.5-point favorite over the average college football team (FBS & FCS) on a neutral field. The other teams rounding out the top 5 in terms of Bettors’ Ratings are Indiana, Georgia, Oregon, and Notre Dame. Interestingly, Texas, the #1 team in the country currently according to the AP poll, checks in at #7 on this list, an unusual situation in which the betting public is not quite fully behind the Longhorns at this point. It could change this week, however, as a 4.5-point favorite at Tennessee.
To be perfectly honest, I don’t personally use these Bettors’ Ratings much for anything other than perhaps market fade or entertainment value. They tend to reflect highly public thinking, and from the work I do on the DraftKings Betting Splits Systems across the varied sports, you know I am not a big fan of getting behind the public in my own betting. The numbers I use for my feed are from DK, and it is probably the most recreational book on the market.
If you’re looking for other teams the markets may be late in embracing besides Texas, Utah State, Vanderbilt, and Ole Miss. On the opposite side of the coin, don’t fall for the betting public’s love of UAB, Wyoming, TCU, or Purdue. These teams have proven to be worse on the field than they were in the preseason publications.
Recent Ratings
My Recent Ratings will take on more and more value as the season wears on. For now, these simply reflect the Effective Strength Ratings, and they use the same format: one rating point equals one point on a line. You will start to notice the differences next week. I only included this introduction in this piece to show you that this is another one of my ratings sets.
Schedule Strength
I don’t include Schedule Strength among my key sets of strength ratings that I use to evaluate teams directly, although they do factor in significantly into the formulation of those ratings. However, they are always an interesting point of discussion. Looking at the first few weeks of the season, the team with the toughest schedule to date is Western Kentucky, out of Conference USA. Kentucky, Stanford, North Texas, and Florida State have also challenged themselves early.
On the other side of the equation, UMass has played the easiest slate among FBS teams, but to be fair, the Minutemen beat Rutgers and are 3-0 for the season, making it difficult to gauge whether they will be ready for the rest of their MAC season. MTSU, Indiana, and Air Force are other FBS teams that have not really challenged themselves to date.
Effective Play-by-Play Strength
The Effective Strength Ratings I described earlier account for scoring stats, but as we all know, many things can happen on the field that can lead to inaccurate evaluations. These include turnovers, penalties, 3rd- or 4th-down success, and decisions made when games are out of hand. Because of that, for the purposes of the rest of this article, what I am going to be determining and sharing with you are the teams whose current EFFECTIVE YARDS PER PLAY (EYYP) stats signify that they might be significantly better or worse than the current perception of them. I believe this is a good way to find over- and underrated teams to take advantage of in the next few games. I will also use a formula to compare teams in this week’s games by their EYPP numbers to see if there’s any point-spread value. Over the course of Weeks 4-7 last year, I believe these “edges” won at about a 54% clip ATS. Not huge, but an advantage nonetheless.
What I’ve done is take the Effective Offensive/Defensive Yards Per Play figures I first ran for the 2026 season on Sunday and assigned them an equivalent power rating on the scale I currently use. I then compared these EYPP Equivalent Ratings to my current Power Ratings, which are based heavily on betting markets and perception.
The assumption is that if the Effective Yards Per Play Equivalent Rating is higher than the average SM power rating, that team is playing better than its perceived strength, and vice versa.
Currently, Georgia is the team rated best on a play-by-play basis using the formula I have in place, followed by Ohio State. The #3 team, however, is SMU. The Mustangs’ equivalent PR in that regard would be 75.5, 19 points better than their actual power rating. Mississippi State, Louisville, and Miami are the only other teams above 70, and all of those teams are also outperforming PR perception.
However, these teams have Effective Yards per Play equivalent power ratings at least 17 points better than their perceived strength and are above USC in that regard. These teams could rightfully be considered “underrated” at this point. Note that these numbers accurately pegged Old Dominion last year as the most underrated team, and the Monarchs went on to win 10 games unexpectedly.
1. SMU – Differential: +19
SM PR: 56.5
Effective YPP Power Rating: 75.5
2. SAM HOUSTON ST – Differential: +18.2
SM PR: 26.5
Effective YPP Power Rating: 44.7
3. MISSISSIPPI ST – Differential: +18.1
SM PR: 55
Effective YPP Power Rating: 73.1
4. TOLEDO – Differential: +17.3
SM PR: 37
Effective YPP Power Rating: 54.3
Alternatively, these are five Teams with Effective Yards per Play equivalent power ratings at least 16 points worse than their perceived strength. Theoretically, these teams would be considered potentially overrated. Watch out if you have the state of Texas in your team name…
1. TEXAS A&M – Differential: -22.8
SM PR: 59.5
Effective YPP Power Rating: 36.7
2. SOUTH ALABAMA – Differential: -16.9
SM PR: 34.5
Effective YPP Power Rating: 17.6
3. TEXAS – Differential: -16.7
SM PR: 68
Effective YPP Power Rating: 51.3
4. TEXAS TECH – Differential: -16
SM PR: 59
Effective YPP Power Rating: 43
Comparing the EYPP equivalent ratings to the actual Week 4 lines:
As far as actionable items, here are the top 15 games for this weekend, based on the differential of EYPP ratings versus actual point spreads, with home field advantage built into the differences. Track these games to see how they fare, or back them already if you agree with the logic.
(387) SAM HOUSTON ST at (388) TEXAS TECH
Actual Line: TEXAS TECH -35.5
Effective Yards per Play Line: TEXAS TECH -2.4
Difference: 33.1 – Favors: SAM HOUSTON ST
2. (333) S ALABAMA at (334) KENTUCKY
Actual Line: KENTUCKY -20.5
Effective Yards per Play Line: KENTUCKY -48.5
Difference: 28 – Favors: KENTUCKY
3. (337) SAN DIEGO ST at (338) TOLEDO
Actual Line: TOLEDO -3
Effective Yards per Play Line: TOLEDO -28.8
Difference: 25.8 – Favors: TOLEDO
4. (383) TEXAS A&M at (384) LSU
Actual Line: LSU -9.5
Effective Yards per Play Line: LSU -31.5
Difference: 22 – Favors: LSU
5. (375) MISSOURI at (376) MISSISSIPPI ST
Actual Line: MISSISSIPPI ST -6.5
Effective Yards per Play Line: MISSISSIPPI ST -28.2
Difference: 21.7 – Favors: MISSISSIPPI ST
6. (329) IOWA at (330) MICHIGAN
Actual Line: MICHIGAN -5.5
Effective Yards per Play Line: MICHIGAN +9.7
Difference: 15.2 – Favors: IOWA
7. (367) AIR FORCE at (368) NEVADA
Actual Line: AIR FORCE -5.5
Effective Yards per Play Line: NEVADA -9.6
Difference: 15.1 – Favors: NEVADA
8. (373) MASSACHUSETTS at (374) SACRAMENTO ST
Actual Line: MASSACHUSETTS -5.5
Effective Yards per Play Line: SACRAMENTO ST +20.1
Difference: 14.6 – Favors: MASSACHUSETTS
9. (327) TEXAS at (328) TENNESSEE
Actual Line: TEXAS -4.5
Effective Yards per Play Line: TENNESSEE -10
Difference: 14.5 – Favors: TENNESSEE
10. (343) VIRGINIA TECH at (344) BOSTON COLLEGE
Actual Line: VIRGINIA TECH -14
Effective Yards per Play Line: BOSTON COLLEGE -0.3
Difference: 14.3 – Favors: BOSTON COLLEGE
11. (307) NAVY at (308) UAB
Actual Line: NAVY -7
Effective Yards per Play Line: UAB -6.9
Difference: 13.9 – Favors: UAB
12. (317) NEBRASKA at (318) MICHIGAN ST
Actual Line: NEBRASKA -5.5
Effective Yards per Play Line: MICHIGAN ST +18.2
Difference: 12.7 – Favors: NEBRASKA
13. (401) NEW MEXICO at (402) NEW MEXICO ST
Actual Line: NEW MEXICO -12.5
Effective Yards per Play Line: NEW MEXICO ST +0.1
Difference: 12.4 – Favors: NEW MEXICO ST
14. (341) OLE MISS at (342) FLORIDA
Actual Line: FLORIDA -3.5
Effective Yards per Play Line: FLORIDA -15.8
Difference: 12.3 – Favors: FLORIDA
15. (339) DELAWARE at (340) VIRGINIA
Actual Line: VIRGINIA -19.5
Effective Yards per Play Line: VIRGINIA -7.3
Difference: 12.2 – Favors: DELAWARE
I will keep posting these edges over the next few weeks should the results warrant it.
Good luck on your Week 4 college football bets!
SPONSORED
RECORD BREAKER! ROBERT FERRINGO just had one of the biggest football weeks in Doc’s Sports’ 56-year history! Robert banked +3,720 with his football picks (documented HERE) and added another +2,350 with his football props (documented HERE). That is an electrifying +6,070 in winnings and he’s looking to add to it this weekend!
Access his premium picks at Doc’s Sports with a free $60 new member account. Get your free trial here!