
Hello,
Welcome to the VSiN NBA betting headquarters. As the 2025-26 regular season wraps up on April 12, the intensity on the hardwood is reaching its peak. Whether you're hunting for NBA picks for today's games to pad your bankroll, looking for deep-value NBA predictions for the 2026 NBA Playoffs or looking to stay ahead of the curve during the NBA Drafts, our experts provide the analytical edge you need. From the high-stakes SoFi Play-In Tournament to the crowning of a new king in the NBA Finals this June, VSiN is your home for sharp basketball insights.
May 16, 2026
Thunder vs. Spurs Western Conference Finals Series Preview Basketball fans should be ecstatic heading into the 2026 Western Conference Finals, as we’re getting the matchup...
May 16, 2026
Today’s NBA Betting Trends: The following NBA betting trends are a collection of analytical data, betting systems and strength ratings featured on VSiN and qualified...
May 15, 2026
The Electric Daisy Carnival has overtaken Las Vegas for the weekend — some of the best people watching in the people-watching capital of the world....
May 14, 2026
The 2025-26 NBA Playoffs continues to deliver memorable moments, and we’re doing our best to make them as profitable as possible for all of our...
May 14, 2026
Today’s NBA Betting Trends: The following NBA betting trends are a collection of analytical data, betting systems and strength ratings featured on VSiN and qualified...
May 13, 2026
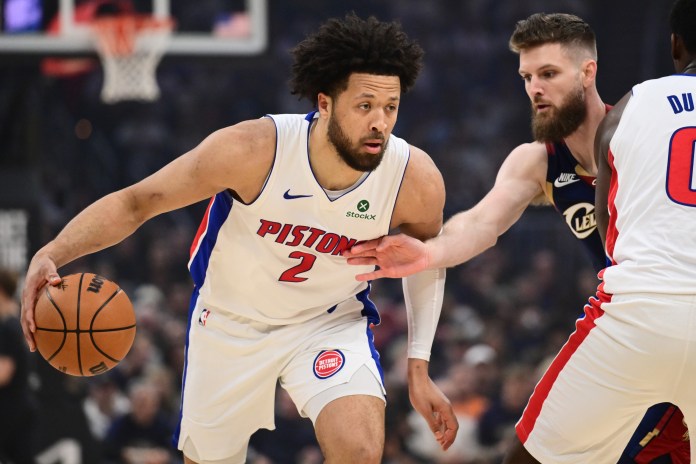
Cavaliers vs. Pistons Pick, Prediction, Odds On Wednesday, May 13, the Cleveland Cavaliers and Detroit Pistons meet at Little Caesars Arena in a pivotal Game...
May 12, 2026
Today’s NBA Betting Trends: The following NBA betting trends are a collection of analytical data, betting systems and strength ratings featured on VSiN and qualified...
May 11, 2026
We’re gearing up for the PGA Championship at Aronimink, which tees off Thursday. Wes Reynolds will file his Best Bets later today. 👉 PGA Championship...
May 11, 2026
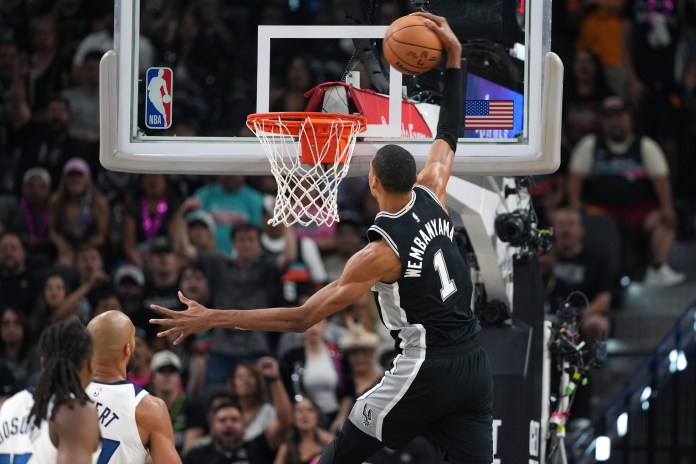
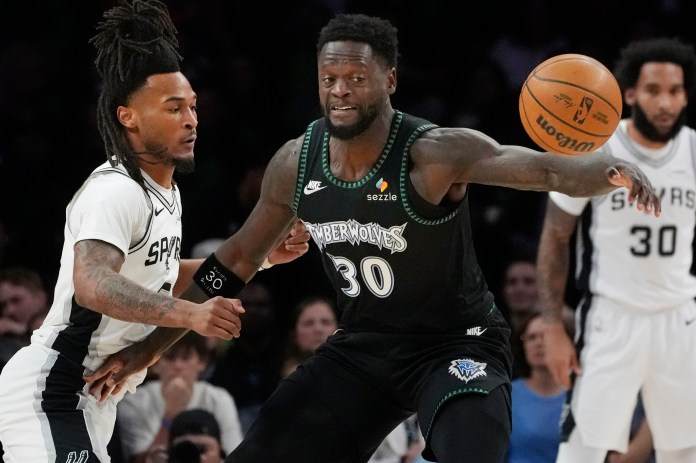
Timberwolves vs. Spurs Pick, Prediction, Odds On Tuesday, May 12, the San Antonio Spurs host the Minnesota Timberwolves in a big Game 5 in the...
May 10, 2026
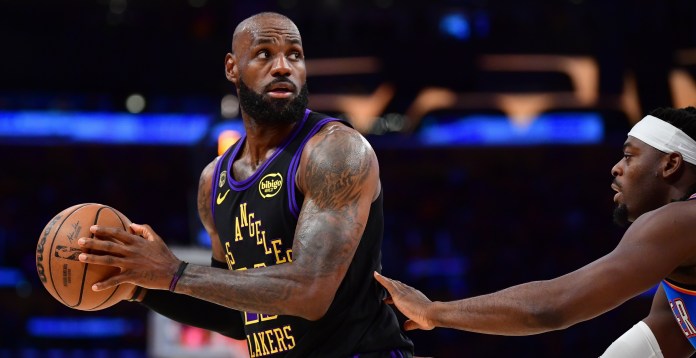
🏀 NBA Playoffs: Thunder eye sweep — and rest The Thunder will go for the sweep tonight against the Lakers — and a week off...
May 10, 2026
The 2025-26 NBA Playoffs should deliver some memorable moments, and we’re going to work hard to make them as profitable as possible for all of...
May 10, 2026
Today’s NBA Betting Trends: The following NBA betting trends are a collection of analytical data, betting systems and strength ratings featured on VSiN and qualified...
Our daily NBA picks are designed to cut through the noise by focusing on load management updates, shooting regressions and officiating tendencies. Every morning, we refresh our NBA picks today to ensure you have the most accurate information before the lines move.
In the final weeks of the season, our NBA best bets prioritize teams fighting for guaranteed playoff spots versus those already locked into the lottery. We don’t just provide a spread; we analyze the “clutch” metrics that determine winners in the final two minutes. If you’re looking for NBA picks for today, look no further than our daily breakdown of totals, player props and moneyline value.
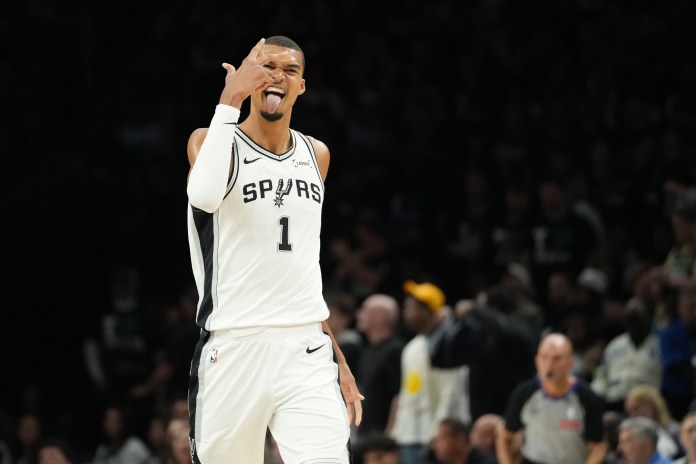
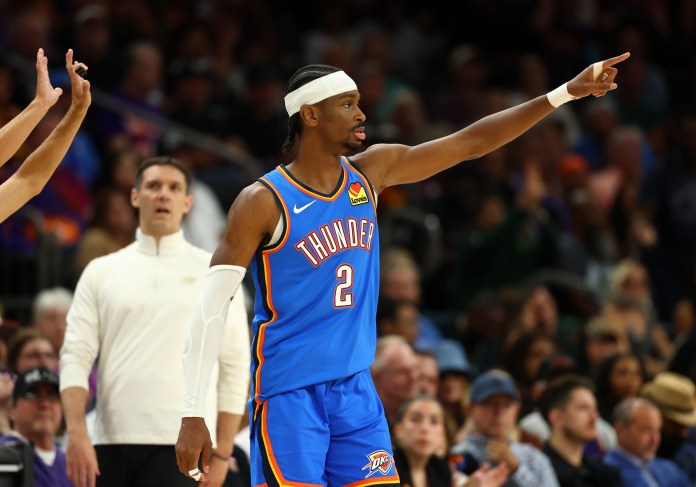
Success in betting professional basketball requires a blend of traditional scouting and advanced analytics. As we look toward the NBA Playoffs starting April 18, our NBA predictions shift to “Series Prices” and tactical coaching adjustments. We analyze how superstars like Victor Wembanyama or Shai Gilgeous-Alexander perform when defenses tighten in a seven-game series. Check back daily for NBA predictions that go beyond the box score to give you a true professional’s perspective on every matchup.
The road to the Larry O’Brien Trophy is officially open. Our futures hub tracks the 2026 NBA Championship odds in real-time, identifying which contenders are peaking at the right time. With the NBA Finals set to tip off on June 3, 2026, identifying early value in the Eastern and Western Conference markets is essential.
We provide specialized coverage of the NBA Playoff Bracket, offering NBA predictions on potential sleepers in the first round. Whether you are betting on a repeat champion or a first-time winner, our analysis of roster depth and playoff experience will guide your NBA bets through every round of the postseason.
Betting on the NBA Playoffs is a different beast than the regular season. Rotations shorten and defensive intensity skyrockets. Stay tuned to VSiN for exclusive betting splits and future trends that will keep you ahead of the curve all the way through the NBA Championship.