
Hello,
Welcome to the VSiN NBA betting headquarters. As the 2025-26 regular season wraps up on April 12, the intensity on the hardwood is reaching its peak. Whether you're hunting for NBA picks for today's games to pad your bankroll, looking for deep-value NBA predictions for the 2026 NBA Playoffs or looking to stay ahead of the curve during the NBA Drafts, our experts provide the analytical edge you need. From the high-stakes SoFi Play-In Tournament to the crowning of a new king in the NBA Finals this June, VSiN is your home for sharp basketball insights.
April 4, 2026
Now that the weekend is here, it’s time to simplify the grind. Instead of splitting sides/totals and player props into separate pieces, my weekend columns...
April 3, 2026
The end of the 2025-26 NBA regular season is rapidly approaching, and Friday, April 3 delivered some big-time news and futures movement that bettors should...

April 3, 2026
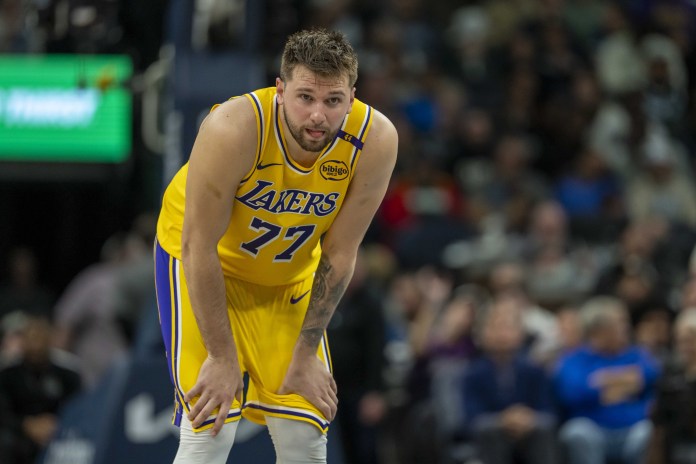
Player props have become one of the NBA’s most entertaining ways to bet, offering value beyond the standard spread or total. Each night, this column...
April 3, 2026
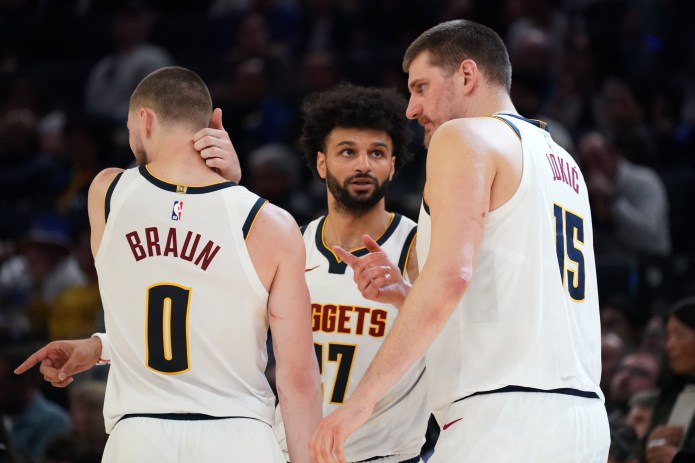
Today’s NBA Betting Trends: The following NBA betting trends are a collection of analytical data, betting systems and strength ratings featured on VSiN and qualified...
April 2, 2026
Player props have become one of the NBA’s most entertaining ways to bet, offering value beyond the standard spread or total. Each night, this column...
April 2, 2026
Today’s NBA Betting Trends: The following NBA betting trends are a collection of analytical data, betting systems and strength ratings featured on VSiN and qualified...
April 2, 2026
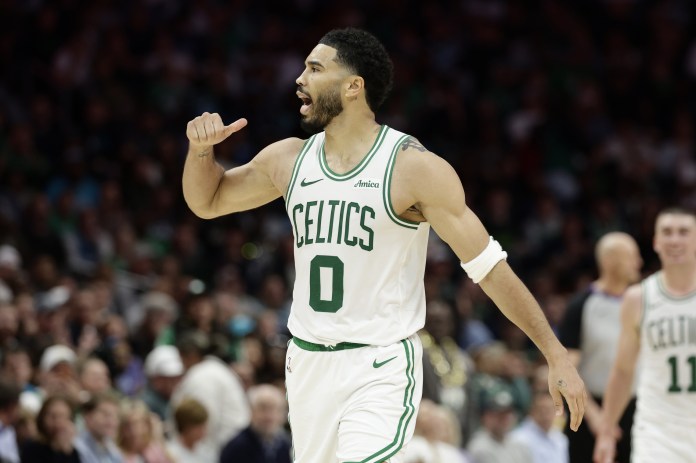
Every night of the 2025-26 NBA season gives us a fresh set of games and numbers to pick apart. This daily column digs into the...
April 1, 2026
Player props have become one of the NBA’s most entertaining ways to bet, offering value beyond the standard spread or total. Each night, this column...
April 1, 2026
Today’s NBA Betting Trends: The following NBA betting trends are a collection of analytical data, betting systems and strength ratings featured on VSiN and qualified...
March 31, 2026
Today’s NBA Betting Trends: The following NBA betting trends are a collection of analytical data, betting systems and strength ratings featured on VSiN and qualified...
March 31, 2026
Every night of the 2025-26 NBA season gives us a fresh set of games and numbers to pick apart. This daily column digs into the...
March 31, 2026
Player props have become one of the NBA’s most entertaining ways to bet, offering value beyond the standard spread or total. Each night, this column...
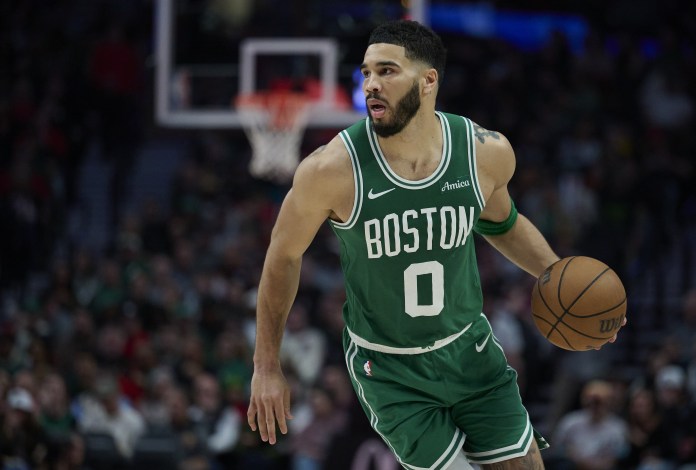
Our daily NBA picks are designed to cut through the noise by focusing on load management updates, shooting regressions and officiating tendencies. Every morning, we refresh our NBA picks today to ensure you have the most accurate information before the lines move.
In the final weeks of the season, our NBA best bets prioritize teams fighting for guaranteed playoff spots versus those already locked into the lottery. We don’t just provide a spread; we analyze the “clutch” metrics that determine winners in the final two minutes. If you’re looking for NBA picks for today, look no further than our daily breakdown of totals, player props and moneyline value.
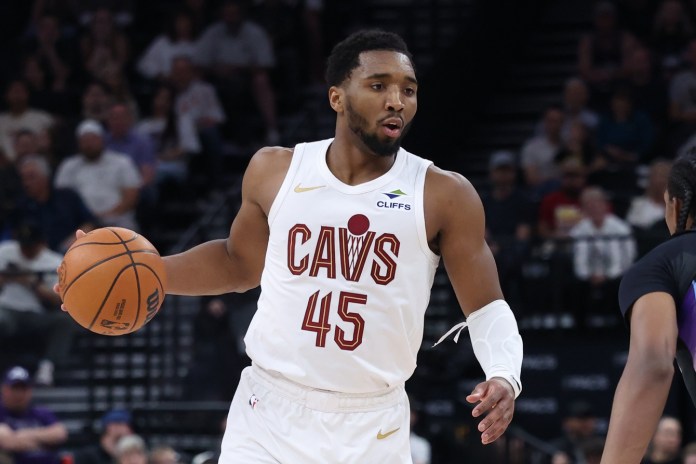
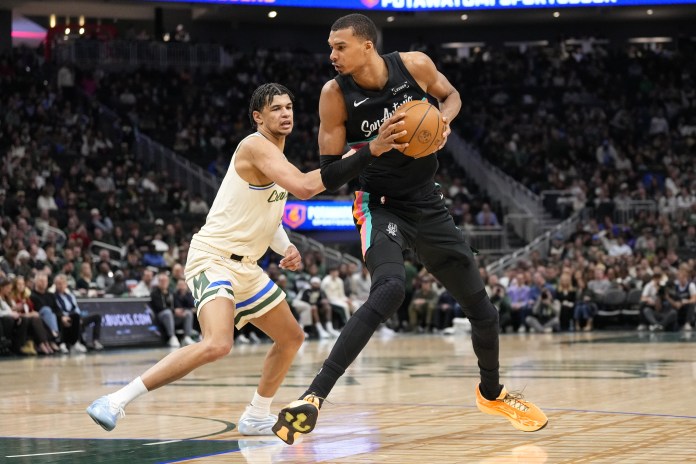
Success in betting professional basketball requires a blend of traditional scouting and advanced analytics. As we look toward the NBA Playoffs starting April 18, our NBA predictions shift to “Series Prices” and tactical coaching adjustments. We analyze how superstars like Victor Wembanyama or Shai Gilgeous-Alexander perform when defenses tighten in a seven-game series. Check back daily for NBA predictions that go beyond the box score to give you a true professional’s perspective on every matchup.
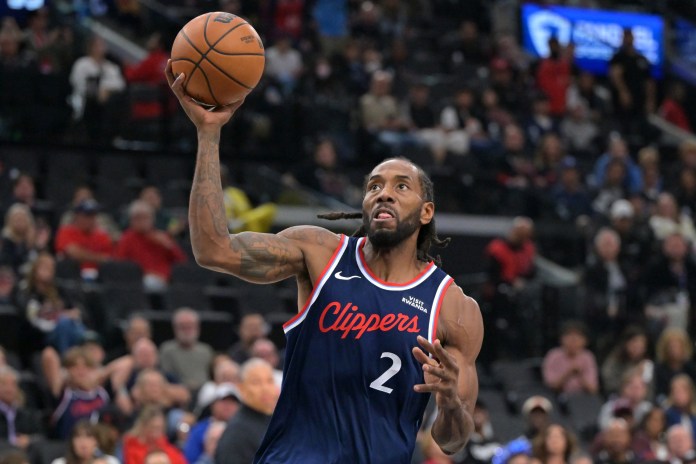
The road to the Larry O’Brien Trophy is officially open. Our futures hub tracks the 2026 NBA Championship odds in real-time, identifying which contenders are peaking at the right time. With the NBA Finals set to tip off on June 3, 2026, identifying early value in the Eastern and Western Conference markets is essential.
We provide specialized coverage of the NBA Playoff Bracket, offering NBA predictions on potential sleepers in the first round. Whether you are betting on a repeat champion or a first-time winner, our analysis of roster depth and playoff experience will guide your NBA bets through every round of the postseason.
Betting on the NBA Playoffs is a different beast than the regular season. Rotations shorten and defensive intensity skyrockets. Stay tuned to VSiN for exclusive betting splits and future trends that will keep you ahead of the curve all the way through the NBA Championship.