Freeway Insurance 500 Predictions: Top 5 Picks and Best Long Shots:
With just four races to go in the 2026 NASCAR Cup Series season, we head to Arizona for the annual fall race at Phoenix International Raceway. That, in itself, will be a big change for the Freeway Insurance 500, as PIR’s fall event was the final championship race every year since 2020.
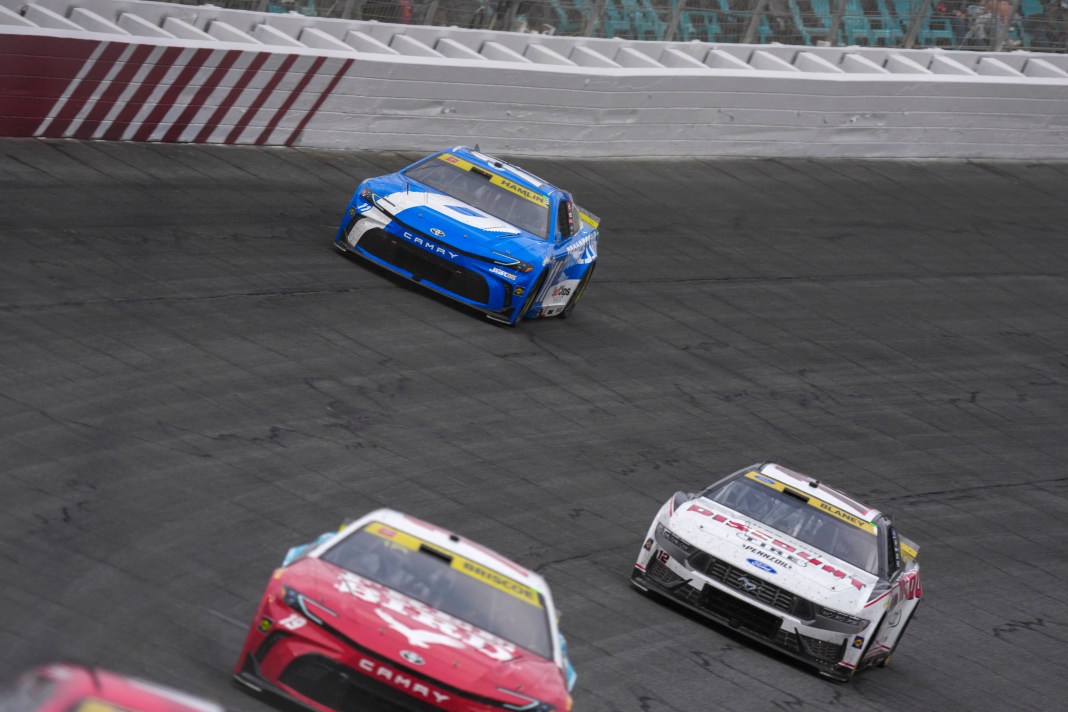
Kyle Larson has a healthy lead in the standings, 49 points over Denny Hamlin. However, Hamlin, Christopher Bell (-51), Ryan Blaney (-85) and Joey Logano (-92) are all within striking distance and have performed well at this track recently. The other current contender I didn’t mention, Chase Briscoe (-65), might not have as good of a Phoenix resume, but he has won back-to-back races to at least put a scare into the competition. Not surprisingly, the six drivers I have mentioned are the six runaway favorites for Sunday’s race, according to DraftKings, all listed at +800 or less. No one else is better than +1200. My initial simulation has a slightly different perspective, with two-time defending PIR champ Blaney a heavy favorite and teammate Logano No. 2.
Can Briscoe make it three in a row on Sunday at Phoenix? Well, I’d caution against never saying never, and he has been reasonably good here the last two years, but this track is far different from the ones we visited the last two weeks. In fact, my initial simulation run finds Briscoe projected in eighth.
Although Las Vegas and Charlotte were officially 1.5-mile ovals, the racing is far different, which makes Sunday’s Freeway Insurance 500 unique compared with anything we’ve seen recently. Phoenix International Raceway is a one-mile track located in Avondale, Arizona, and best known for its wide racing surface, its fantastic weather conditions and for being the track where you’ll see drivers take huge dives into the apron. In fact, Google describes it as “NASCAR drivers aggressively diving down into the low-colored asphalt apron and flat interior section of the dogleg — the unique, elbow-shaped kink along the front stretch at Phoenix Raceway — to shorten their distance and gain a speed or position advantage during restarts and short runs.” When they come back up into the front stretch, things can get interesting. PIR is a short track in nature, and like most other short tracks on the circuit, has proven fairly predictable in my simulations. In fact, in terms of handicap-ability grades, PIR gets a B+. Hopefully that will mean getting back some decent profits this week.
Before digging into what to look for statistically at Phoenix, here’s a quick wrap-up of what happened last week at Charlotte and how our simulation projections have fared in terms of betting results to date through 32 races.
Initial Charlotte simulation winner: Loser (-1 unit) – NOW -4.15 units for the season
Final Charlotte Simulation winner: Loser (-1 unit) – NOW +28.05 units for the season (These are +84.85 units for the last two seasons!)
Final Charlotte Simulation Top 2 drivers To Win: Two losers – total return -2 units – NOW +6.35 units for the season
Final Charlotte Simulation Top 3 drivers To Win: Three Losers – total return -3 units – NOW +3.65 units for the season (Briscoe won while being projected 5th for second week in a row)
Final simulation top 3 Charlotte projections: two winners, one loser – total return +2.6 units – NOW -1.1 units for the season
Final simulation top 5 Charlotte projections: two winners, three losers – total return -2.85 units – Now -38.85 units for the season
We also scored six more top-10s, and if you go by my NASCAR wagering standard of never laying more than -250 on any bet, that would have netted -3.85 units. In the last two weeks, we won in excess of +8 units of profit on top-10s. Next season, I will be tracking my results using the new -250 threshold strategy,
Now for my final personal picks, which are published each race day in the VSiN Email Newsletter…
Final simulation top 5 Charlotte projections: three winners, two losers – total return -0.25 units – Now -53.8 units for the season
Top Charlotte Longshots to win: four losers – total return -4 units – Now -19 units for the season
Favorites to struggle at Charlotte: Elliott (12th), Hocevar (14th), Chastain (16th), Bowman (38th) – Now 92 for 129 for the season picking usual contending drivers to finish outside of the top 10.
Now let’s look ahead to Phoenix on Sunday, using the stats from the four races that have been run here over the last two seasons. Like most short tracks, the speed and handling of a car, as well as the ability to maneuver in traffic, have been paramount to success at PIR. Momentum has also been key. In fact, the two most critical simulation factors at this facility are recent overall performance and recent performances at tracks similar to PIR. The qualifying and practice speeds will change things on the simulation, although neither has proven to be a major factor recently at PIR. Still, keep a close eye on what happens Saturday afternoon at the track to see if anyone can unseat Blaney from the top spot. Of course, if you miss it, don’t fret; those results will be entered into the final simulation projections. Here are the stats for the last four races at PIR for all active drivers that have raced here, with Blaney being a back-to-back winner here:
Average STARTING POSITION last four races at Phoenix
1. Joey Logano: 3.75
2. William Byron: 5
3. Kyle Larson: 6.5
4. Carson Hocevar: 7.75
5. Austin Cindric: 8
6. Denny Hamlin: 9
…
22. Darrell Wallace: 24.75
23. AJ Allmendinger: 25.67
24. Brad Keselowski: 25.75
25. Shane Van Gisbergen: 26
26. Austin Dillon: 27
27. Todd Gilliland: 29.75
Average PRACTICE SPEED RANK last four races at Phoenix
1. Austin Cindric: 4.25
2. Ryan Blaney: 6
3. Ty Gibbs: 6.75
4. Carson Hocevar: 8.75
5. Denny Hamlin: 8.75
6. William Byron: 10
…
22. Josh Berry: 24.25
23. Austin Dillon: 24.75
24. Ricky Stenhouse: 26
25. Brad Keselowski: 26.5
26. AJ Allmendinger: 31.67
27. Shane Van Gisbergen: 32.67
Average RUNNING POSITION last four races at Phoenix
1. Christopher Bell: 4.5
2. William Byron: 5.25
3. Ryan Blaney: 6.25
4. Denny Hamlin: 6.25
5. Joey Logano: 7.5
6. Kyle Larson: 8.5
…
22. Ty Gibbs: 22.5
23. Chase Briscoe: 24
24. Ricky Stenhouse: 24.5
25. Michael McDowell: 25
26. AJ Allmendinger: 25.33
27. Shane Van Gisbergen: 27.33
Total LAPS LED last four races at Phoenix
1. Christopher Bell: 106
2. Joey Logano: 65.25
3. Denny Hamlin: 54
4. William Byron: 38.75
5. Ryan Blaney: 15
6. Ryan Preece: 9.5
…
16. Tyler Reddick: 0
17. Chris Buescher: 0
18. Ross Chastain: 0
19. Carson Hocevar: 0
20. Daniel Suarez: 0
21. Darrell Wallace: 0
22. Erik Jones: 0
23. Austin Dillon: 0
24. Ricky Stenhouse: 0
25. Michael McDowell: 0
26. AJ Allmendinger: 0
27. Shane Van Gisbergen: 0
Average DRIVER RATING last four races at Phoenix
1. Christopher Bell: 127.3
2. Denny Hamlin: 114.08
3. Ryan Blaney: 113.7
4. Joey Logano: 113.13
5. William Byron: 108.63
6. Kyle Larson: 104.03
…
22. Austin Dillon: 58.78
23. Ty Gibbs: 57.95
24. Michael McDowell: 56.78
25. Ricky Stenhouse: 50.15
26. Shane Van Gisbergen: 48.43
27. AJ Allmendinger: 45.63
Most AVG LAPS RUN in TOP 15 last four races at Phoenix
1. Christopher Bell: 311.75
2. Denny Hamlin: 305
3. William Byron: 298.25
4. Ryan Blaney: 294.75
5. Kyle Larson: 282
6. Joey Logano: 273.75
…
22. Michael McDowell: 53
23. Todd Gilliland: 44.5
24. Austin Dillon: 43.25
25. Shane Van Gisbergen: 35.67
26. AJ Allmendinger: 26
27. Ricky Stenhouse: 22.25
Best AVERAGE FINISH last four races at Phoenix
1. Kyle Larson: 3.25
2. Christopher Bell: 4.75
3. Denny Hamlin: 6
4. Ryan Blaney: 8
5. Chris Buescher: 10
6. Alex Bowman: 12
…
22. Ty Gibbs: 22.5
23. Ricky Stenhouse: 23.25
24. Austin Cindric: 25
25. Carson Hocevar: 25.5
26. AJ Allmendinger: 26.33
27. Chase Briscoe: 29.75
Those stats show a mix of Penske, Joe Gibbs and Hendrick teams dominating the leaderboards. In fact, if I were to pick four dominant drivers in recent years here, they would be Bell, Blaney, Logano and Hamlin. This race could prove very key for those guys as they are getting to a desperate state in terms of points and the ability to run down Larson for the title.
With those stats in mind, my top-rated drivers at Phoenix, in order, are Bell, Blaney, Logano, Hamlin, Byron. For track designation ratings (short tracks), the order is Blaney, Berry, Logano, Larson, Briscoe. In terms of recent ratings, the top 5 are Larson, Briscoe, Bell, Blaney and Logano. All of it goes into the making of my initial simulation, which can be seen now on the NASCAR HUB at VSiN.com.
The final simulation will be made available Saturday afternoon after practice and qualifying, which is set for 4:30 p.m. ET. That said, having to make my predictions at this point (which could change a bit after P&Q), I would go with the following:
Top 5: Blaney, Bell, Logano, Hamlin, Briscoe
Top underdogs to consider (+1200 or better): Byron, Cindric, Berry, Hocevar
Favorites to struggle: Gibbs, Reddick, Wallace, Elliott
The 312-lap event at PIR is set for 3 p.m. ET on Sunday.
Be sure to visit VSiN.com for this week’s full INITIAL SIMULATION. This is where you’ll find the sims all season long. While there, you can click on driver links for season stats and recent results, plus get current odds, and much, much more.
SPONSORED
8 STRAIGHT WINNERS. +$3,200.
The Doc’s Sports AI is absolutely hammering the books — and these games HAVEN’T EVEN BEEN CLOSE.
During this 8-game winning streak, the average cover margin is a ridiculous 13.75 points – See Here
And this isn’t some one-week heater.
Since launching less than a year ago, Doc’s Sports AI has generated more than +$22,500 in profit for $100-per-unit bettors.
Now Doc’s Sports AI-v3 is unleashed for football season — and it’s already delivering.
8 STRAIGHT. +$3,200. +$22,500 SINCE LAUNCH.
The numbers are doing the talking. Today you can use promo code VSIN90AI and get 90% off a 3 day package of Doc’s Sports AI-v3