


XFinity 500 Predictions: Top 5 Picks and Best Long Shots:
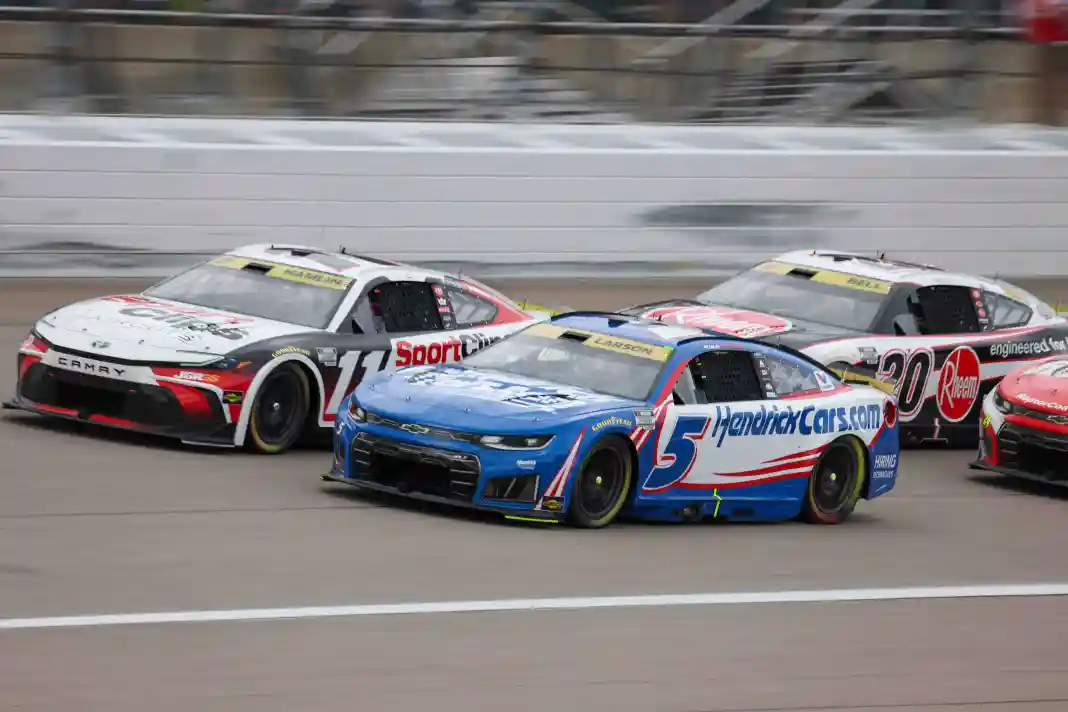
As predicted, things got wild at Talladega this past Sunday as the track earned its F+ handicap-ability grade. As many top contenders were taken out at various points in the YellaWood 500, a strange “underdog” took home the checkered flag. That underdog may have also essentially clinched the season title, as Kyle Larson won at +1800 odds and boosted his championship standings lead to what seems like an insurmountable 73 points with just two races remaining. What’s more, the next track, Martinsville, has been a solid one for Larson, and expecting mechanical trouble or a race-ending wreck isn’t realistic. In fact, with Martinsville boasting a handicap-ability grade of A-, Larson is more likely to finish closer to his projected 2nd-place finish than anything else.
So while Talladega was a rich reward type of track for underdog bettors, Martinsville is far from. It is a flat short track, and anyone who has followed this column all season long knows that those tracks typically earn the highest grades on my handicap-ability scale. Thus, with a breakaway five drivers of Denny Hamlin, Larson, Christopher Bell, Joey Logano, and March winner here Chase Elliott topping the field, it’s a pretty solid bet that one of those five or a high projected driver on the final simulation will make the visit to Victory Lane at Sunday’s Xfinity 500. Of the other drivers I could see making a dent in that top 5, consider Ryan Blaney, a two-time winner here in the next gen car, and William Byron, a three-time winner, as best options. The seven drivers I have mentioned are the official favorites at DraftKings at the outset of the week, all listed at +900 or better.
Martinsville is one of the smallest tracks on the circuit, at .526 miles around, and its shape genuinely resembles a paper clip. Much of what happens here revolves around track position, as drivers running out front can easily catch up to the back of the field in a short number of laps. Holding the bottom of the track and managing the brakes are the two most important things for crews when setting up the cars. You’ll see a lot of “bump & runs,” and for drivers who are the victims, getting kicked out of line can often cost them multiple positions. Even though Martinsville isn’t nearly as physically grueling as road courses or Darlington, being packed tightly for 500 laps around this tight racing surface can be mentally tough for drivers. If you watched or bet on the race here in March, you might notice there are 100 more laps this time around. That could change the strategy the contending teams employ.
Before digging into what to look for on Sunday, here’s a quick wrap-up of what happened last week at Talladega, and how our simulation projections have fared in terms of betting results to date with two races remaining.
Initial Talladega simulation winner: Loser (-1 unit) – NOW -6.15 units for the season
Final Talladega Simulation winner: Loser (-1 unit) – NOW +26.05 units for the season (These are +82.85 units for the last two seasons!)
Final Talladega Simulation Top 2 drivers To Win: Two losers – total return -2 units – NOW +2.35 units for the season
Final Talladega Simulation Top 3 drivers To Win: Three Losers – total return -3 units – NOW -2.45 units for the season (Larson won from the 4th projected position)
Final simulation top 3 Talladega projections: three losers –total return -3 units – NOW -5.1 units for the season
Final simulation top 5 Talladega projections: one winner, four losers – total return -1.5 units – Now -42.25 units for the season
We hit on just two Top 10s with Larson +110 & Chastain +140. To show you the potential at Talladega in terms of underdogs, Cole Custer scored a Top 10 with +400 odds.
Now for my final personal picks, which are published each race day in the VSiN Email Newsletter…
Final simulation top 5 Talladega projections: five losers –total return -5 units – Now -59.8 units for the season
Top Talladega Longshots to win: six losers –total return -6 units – Now -15 units for the season
Favorites to struggle at Talladega: Elliott (36th), Gibbs (17th), Reddick (37th), Larson (1st)– Now 96 for 137 for the season, picking usual contending drivers to finish outside of the top 10.
I told you that Talladega could get wild. Hopefully you were able to take advantage of some of the other top underdogs from the simulation, like Ross Chastain, who grabbed a fourth-place finish and had a top-5 price of +350 and a top-10 price of +140. It was a truly wild YellaWood 500, even with only four official cautions. Any one of seven drivers could have won at the end had they made the right move, as Larson did. That said, overall, I feel like we are limping to the finish line this season in terms of our betting action. Hopefully we can wrap up the year with two solid runs.
Looking ahead to Martinsville on Sunday, I dug out the stats for the last four races run at this paper clip-shaped short track oval over the last two calendar years. Typically, this track is all about track position, handling, managing brakes, and clever pit decisions. Pit crews are crucial in a race like this, and most cars finish. Only 14 cars in the last five races have failed to do so. Of the simulation factors, starting position and recent history at Martinsville have stood out more than the others.
There is qualifying and practice on Saturday, and the former has proven to be far more important. In fact, of the last nine Next Gen car pole sitters, four finished second, and another won a race. That said, with what is currently a five-car breakaway at the top, I’d be surprised to see anyone outside that tightly grouped Top 5 on the projections win. Here are the stats for the last four races at Martinsville for all active drivers that have raced here, with Chase Elliott, William Byron, Denny Hamlin, and Ryan Blaney winning the races covered:
Average Starting Position for the Last Four Races at Martinsville
1. William Byron: 4
2. Chase Elliott: 5.5
3. Ty Gibbs: 6
4. Kyle Larson: 7.25
5. Joey Logano: 8
6. Alex Bowman: 9
…
22. Ryan Blaney: 22.25
23. Shane Van Gisbergen: 22.25
24. Daniel Suarez: 24.5
25. Erik Jones: 24.75
26. AJ Allmendinger: 28
27. Ricky Stenhouse: 31.75
Average Practice Speed Rank for the Last Four Races at Martinsville
1. Denny Hamlin: 2.75
2. Chase Elliott: 5
3. Ty Gibbs: 5.5
4. Darrell Wallace: 5.75
5. William Byron: 8.5
6. Christopher Bell: 10.25
…
22. Brad Keselowski: 23.75
23. Ricky Stenhouse: 24.5
24. Tyler Reddick: 25
25. Shane Van Gisbergen: 25.75
26. Chris Buescher: 30.25
27. Austin Cindric: 30.75
Average Running Position in the Last Four Races at Martinsville
1. Chase Elliott: 6
2. Kyle Larson: 6.75
3. Ryan Blaney: 7
4. William Byron: 7.25
5. Denny Hamlin: 7.5
6. Joey Logano: 8.5
…
22. Daniel Suarez: 21.25
23. Carson Hocevar: 21.25
24. Erik Jones: 21.75
25. Ricky Stenhouse: 27.25
26. Chris Buescher: 27.5
27. AJ Allmendinger: 28
Average Fastest Laps for the Last Four Races at Martinsville
1. Chase Elliott: 46.5
2. Denny Hamlin: 42.75
3. William Byron: 38.75
4. Ryan Blaney: 35.25
5. Kyle Larson: 24
6. Joey Logano: 16.25
…
22. Ross Chastain: 4.25
23. Michael McDowell: 2.75
24. Carson Hocevar: 2.75
25. AJ Allmendinger: 2.33
26. Ricky Stenhouse: 1.25
27. Erik Jones: 0
Average Driver Rating the Last Four Races at Martinsville
1. Chase Elliott: 120.48
2. Denny Hamlin: 119.03
3. Ryan Blaney: 111.85
4. Kyle Larson: 107.15
5. Joey Logano: 99.78
…
22. Carson Hocevar: 58.5
23. Daniel Suarez: 58.1
24. Erik Jones: 51.63
25. Chris Buescher: 46.45
26. AJ Allmendinger: 46.3
27. Ricky Stenhouse: 42.68
Most Average Laps Run in the Top 15 for the Last Four Races at Martinsville
1. Kyle Larson: 436.25
2. Chase Elliott: 430.5
3. Ryan Blaney: 419
4. Joey Logano: 418.75
5. William Byron: 390.75
6. Denny Hamlin: 384
…
22. Carson Hocevar: 64.25
23. Erik Jones: 44.5
24. Daniel Suarez: 44.25
25. Chris Buescher: 30.5
26. Ricky Stenhouse: 10.25
27. AJ Allmendinger: 4.67
Best Average Finish in the Last Four Races at Martinsville
1. Chase Elliott: 2.5
2. Ryan Blaney: 5
3. Kyle Larson: 5.5
4. Joey Logano: 7.25
5. William Byron: 8.5
6. Ross Chastain: 8.5
…
22. Michael McDowell: 21.75
23. Carson Hocevar: 23
24. Ricky Stenhouse: 24.25
25. Erik Jones: 24.5
26. Chris Buescher: 25.75
27. AJ Allmendinger: 26
There are some drivers with very strong resumes just from the stats above, and Hendrick Motorsports seems to be the team to beat when we come here. With those stats in mind, my top-rated drivers at Martinsville, in order, are Hamlin, Elliott, Blaney, Byron, Logano. In terms of Track Designation ratings, the top guys are Blaney, Berry, Logano, Larson, Briscoe. And finally, for recent ratings, the top 5 are Larson, Blaney, Bell, Briscoe, Logano. All of it goes into the making of my initial simulation, which can be seen now on the VSiN.com website by navigating under the SPORTS tab to AUTO RACING, then to NASCAR HUB.
The final simulation will be available Saturday afternoon after practice & qualifying, set for 1:00 p.m. ET. That said, having to make my predictions at this point (which could change a bit after practice and qualifying), I would go with the following:
Top 5: Hamlin, Elliott, Logano, Blaney, Larson
Top underdogs to consider (+1200 or higher): Wallace, Berry, Gibbs, Chastain
Favorites to struggle: Briscoe, Buescher, Hocevar, Van Gisbergen
The 500-lap event at Martinsville is set for 2:00 p.m. ET on Sunday, November 1st.
Be sure to visit VSiN.com for this week’s full initial simulation. This is where you’ll find the sims all season long. While there, you can click on driver links for season stats and recent results, plus get current odds and much, much more.