
Hello,

Welcome to your premier destination for college football betting intelligence. From the opening weekend of the season in late August through the College Football Playoff National Championship in January, VSiN delivers weekly NCAAF picks and expert predictions to help you navigate every game on the slate - from Power Four marquee matchups to the Group of Five games where sharp bettors consistently find the most value. Whether you're betting the point spread, the total, or hunting early-market value in CFP futures and conference championship odds, our analysts provide the college football betting advice you need to stay ahead of the line all season long.
January 18, 2026
Miami vs. Indiana One of the biggest draws to the expanded 12-team College Football Playoff is that it allows more teams to have a chance...
January 18, 2026
VSiN Director of Analytics Steve Makinen put together his College Football Playoff Analytics Report for the title game. Using those stats and trends and more,...
January 18, 2026
Tuley’s Takes – College Football Playoff Final Best Bets, Picks and Predictions: We’re excited in the Tuley’s Takes home office for the CFB Playoff Championship...
January 18, 2026
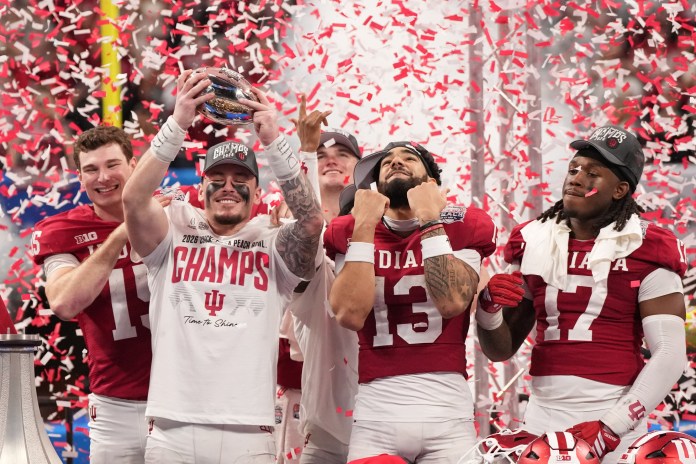
College Football Playoff National Championship Best Bets, Predictions and Picks from Wes Reynolds: The Indiana Hoosiers began the season at 100/1 on BetMGM to win...

January 18, 2026
College Football Playoff National Championship Predictions The time has come for college football’s ultimate prize to be awarded on Monday night, and the Miami Hurricanes...
January 14, 2026
Bowl Game This will be the home for all of our College Football Bowl Game content, including a schedule, previews and predictions for each game,...
January 13, 2026
Some are already calling it the “Curt Cignatty”, as his juggernaut team is the favorite for the CFP National Championship Game in Miami Gardens, FL...
College Football, The VSiN Daily
January 10, 2026
Indiana will meet Miami for the CFP title on Monday, Jan. 19 on the Hurricanes’ home turf. The line is IU -7.5, which is understandable...
January 9, 2026
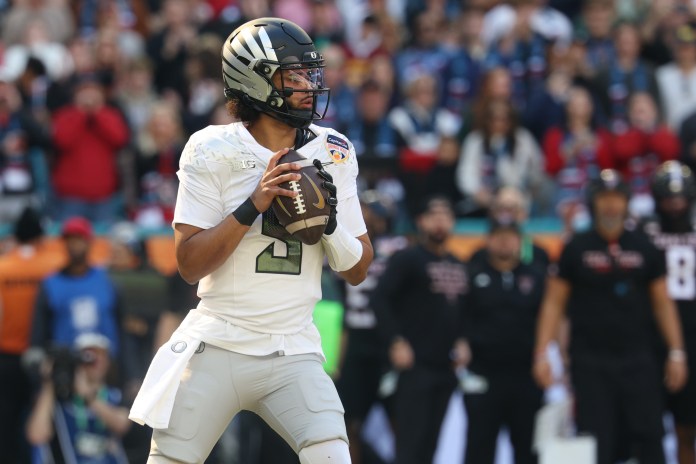
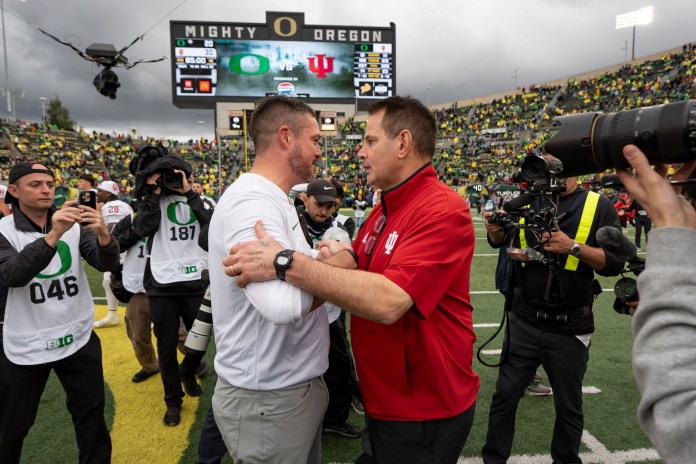
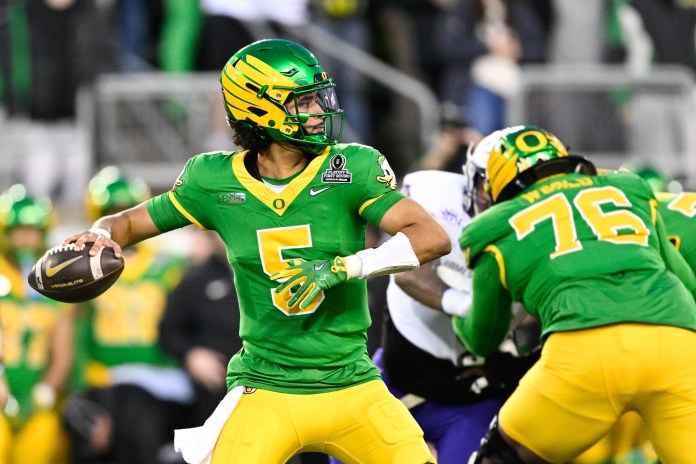
The College Football Playoff semifinals continue tonight with a primetime showdown between Oregon and Indiana. Let’s examine where smart money is leaning for tonight’s matchup...
College Football, The VSiN Daily
January 8, 2026
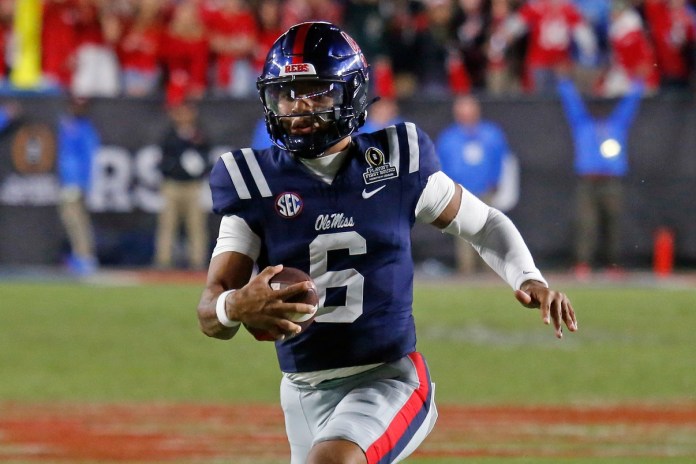
Miami advanced to the CFP championship game on its home turf by rallying to beat Ole Miss 31-27 on Thursday night. The Hurricanes covered the...
January 8, 2026
College Football Playoff Semifinals Best Bets, Predictions and Picks from Matt Youmans Here are my best bets for this week’s CFP Semifinals: Miami (FL) (-3.5)...
January 8, 2026
Oregon vs. Indiana On Friday, January 9, the Oregon Ducks and Indiana Hoosiers will battle for a spot in the College Football Playoff National Championship...
In a sport defined by massive talent gaps between programs, extreme home-field advantages, and coaching decisions that can swing a game in an instant, our college football picks stand out by focusing on the situational edges that professional handicappers have exploited for decades. Every week, we update our NCAAF picks to account for late-breaking injury news, depth chart changes following the transfer portal window, motivational mismatches between ranked opponents and overmatched opponents, and the kind of scheduling spots – look-ahead games, rivalry week traps, and post-bye-week bounce-back angles – that create consistent line value before the public catches on.
Whether you are looking for college football best bets on the spread, diving into game totals and first-half lines, or targeting a massive underdog in a conference opener, our analysts break down the advanced offensive and defensive efficiency metrics that truly separate elite programs from those living off reputation. As conference races tighten in October and November, our weekly college football picks shift to track which teams are playing with championship urgency versus those already looking ahead to bowl season, ensuring your bets are always backed by the most current situational intelligence available.
Success in college football betting requires looking past the AP Poll and ESPN’s talking heads. Our NCAAF predictions leverage advanced metrics – EPA per play, success rate, havoc rate, finishing drives, and defensive SP+ ratings – to find the real gap between two teams that a point spread may not fully capture. Because college football rosters turn over faster than any other sport, our analysts track transfer portal movement, early-enrollment freshmen impact, and how quickly new coordinators implement their systems to stay ahead of a market that is often slow to fully adjust.
As the schedule moves through its biggest stages – rivalry week showdowns, College Football Playoff Selection Show weekend, and conference championship Saturday – our college football predictions provide deep dives into which programs are legitimately elite and which are benefiting from weak schedules or fortunate turnover margins that won’t sustain into high-stakes games. By combining modern data analytics with traditional situational handicapping, our NCAAF forecasts deliver a level of matchup detail that generic sports betting sites simply can’t replicate.
The College Football Playoff has expanded to 12 teams, and VSiN provides comprehensive CFP betting coverage from the moment the bracket is revealed through National Championship night. Our CFP picks analyze first-round home-site advantages, how top seeds historically perform as massive favorites in the opening round, and which double-digit seeds carry genuine upset potential based on their defensive profile and late-season momentum rather than their overall ranking.
We track CFP National Championship futures from the preseason, flagging when blue-blood programs like Ohio State, Georgia, Alabama, and Michigan are overpriced based on early hype, and when a mid-major power or rising program like last season’s Indiana Hoosiers – who opened at 100/1 before reaching the title game – offers legitimate long-shot value before the market collapses. Trust VSiN to keep you on the right side of CFP futures from the first week of the season through the final confetti in January.
College football bowl season stretches from mid-December through the CFP semifinals in early January, and VSiN publishes dedicated betting previews and best bets for every major bowl game on the calendar. Our bowl game picks account for the factors that separate sharp bowl bettors from the public: player opt-outs ahead of the NFL Draft, coaching staff changes that undermine preparation, travel and neutral-site advantages, and how teams with 30 extra practice days use that time differently based on their roster composition.
From the Rose Bowl and Sugar Bowl as CFP quarterfinals to the Peach Bowl, Fiesta Bowl, and Cotton Bowl as national semifinal sites, our analysts publish full betting breakdowns covering spread, total, and prop markets. For bettors looking to capitalize on the most inefficiently priced games of the year, VSiN’s bowl game coverage is your complete resource from the first kickoff of bowl season to the final play of the National Championship.
College football offers some of the most diverse betting markets in all of sports, and VSiN’s NCAAF betting advice is designed to help you navigate every angle. Game totals in college football are among the most consistently beatable markets available – because weather, tempo, and quarterback efficiency can swing scoring by 20+ points in either direction – and our analysts publish dedicated totals analysis alongside their spread picks each week throughout the season.
We also cover conference championship futures, Heisman Trophy betting, and season win totals from the moment sportsbooks post them in the spring, identifying which programs are undervalued in the market based on schedule strength, returning production, and portal additions before the public drives prices toward fair value. Whether you are a seasoned college football bettor or approaching NCAAF wagering for the first time, trust VSiN to deliver the picks, predictions, and betting advice to keep you competitive from Week 0 through National Championship night.