Week 0 College Football Power Ratings:
Let’s all sit down at the college football table and enjoy some appetizers. Maybe we can consider them hors d’oeuvres, if you prefer. But, we have eight games and 16 teams taking the field in Week 0 and that is a glorious thing. Baseball is great and we had the World Cup to hold us over this summer, but football season has arrived and that’s awesome.
As usual, we head into the season doing a lot of guesswork. The betting markets have been molded into shape, at least in terms of season win totals and futures, even though most teams have undergone more modifications than the Kardashian family. The chaos of the transfer portal and coaching carousel is a hard thing to quantify and pin down, but it’s the nature of the beast and the challenge that we have all accepted.
This season, I did something very different with my power ratings. I surveyed six sources, some that I personally trust and some that serve as more of a market perspective, and got an assist from ChatGPT to recalculate those ratings to my normal range, which is about 40 to 95 at the start of the season, where my top team is somewhere in the low-to-mid 90s and my bottom team is around 40. I think AI does a terrible job with writing, but it seemed to do a pretty good job helping me with a lot of math that I didn’t want to do.
Those six sources? Our own Steve Makinen, the T Shoe Index of our own Tyler Shoemaker, frequent VSiN guest and my good buddy Brad Powers, Bill Connelly’s SP+, ESPN’s Football Power Index (FPI), and TeamRankings. (As a side note, we’ll be getting more NFL Survivor coverage from our friends at TeamRankings/PoolGenius this season!)
Why did I decide to do what I did? The wisdom of crowds is a much more effective way to put a value on these teams than trying to do my own research and slapping a value on the position groups to ultimately get to a power rating. I will still make my own adjustments week to week, which is the “art” part, and I relied on those sources to help me with the “science” part.
I also think it’s a really good mix. Brad’s somebody who watches every spring game that he can find and he’s super plugged in. Steve and Tyler approach it more from a quant standpoint, same thing with Connelly and FPI. I think TeamRankings is a good gauge for the market as a whole since their numbers are publicly available.
I did make a few adjustments based on my thoughts from all the research I did for our 2026 College Football Betting Guide. I just wanted to have a good foundation to begin with and then build from there. How I came to my home-field advantage numbers is in the betting guide, but I’ll be posting that article to the website this week.
Lastly, before I list my 1 through 138 (hello Sac State and North Dakota State!), the function of these power ratings is to try and get some good line equity early in the week. It’s much harder to do that in Week 0 and Week 1 because these lines have been out forever. Generally speaking, Sunday-Tuesday, I’ll rely on my power ratings to give me a good number on a game and bet into the market accordingly. By Wednesday, my power ratings are less of a factor and the more qualitative aspects of the handicap come into play, things like weather, the schedule, the stylistic matchup, etc.
But, as always, I’ll be sharing my power ratings with all of you each week of the season, typically early Sunday afternoon. These updates will include my lines for every game of the week as well, plus some notes on the games that have bigger discrepancies that I am either betting or strongly considering.
Week 0 College Football Power Ratings
| Rank | Team | PR | HFA |
| 1 | Ohio State | 93 | 3.5 |
| 2 | Notre Dame | 92.5 | 3.5 |
| 3 | Oregon | 92 | 3.5 |
| 4 | Indiana | 90.5 | 3.5 |
| 5 | Georgia | 90.5 | 2.5 |
| 6 | Texas | 90.5 | 3.5 |
| 7 | Miami (Florida) | 87.5 | 3 |
| 8 | Texas Tech | 86.5 | 3.5 |
| 9 | Texas A&M | 85.5 | 2 |
| 10 | Alabama | 84.5 | 3.5 |
| 11 | LSU | 84.5 | 3 |
| 12 | Oklahoma | 84 | 3 |
| 13 | Mississippi | 83.5 | 3.5 |
| 14 | USC | 83.5 | 3 |
| 15 | Michigan | 83 | 2.5 |
| 16 | Tennessee | 81 | 2.5 |
| 17 | Penn State | 80.5 | 2.5 |
| 18 | Florida | 80 | 2 |
| 19 | BYU | 79.5 | 3.5 |
| 20 | Washington | 79 | 3.5 |
| 21 | Missouri | 78.5 | 3.5 |
| 22 | Iowa | 78 | 3.5 |
| 23 | SMU | 78 | 3.5 |
| 24 | South Carolina | 78 | 2.5 |
| 25 | Auburn | 77.5 | 2 |
| 26 | Clemson | 77.5 | 2.5 |
| 27 | Utah | 77 | 2.5 |
| 28 | Louisville | 76.5 | 3.5 |
| 29 | Vanderbilt | 75 | 2.5 |
| 30 | Arizona | 74.5 | 3 |
| 31 | Houston | 74.5 | 2 |
| 32 | Illinois | 74 | 2.5 |
| 33 | Florida State | 74 | 2.5 |
| 34 | Kansas State | 74 | 3 |
| 35 | Virginia Tech | 74 | 2 |
| 36 | Pittsburgh | 73.5 | 2.5 |
| 37 | TCU | 73.5 | 2.5 |
| 38 | Virginia | 73.5 | 2 |
| 39 | Nebraska | 73.5 | 2 |
| 40 | Arizona State | 72 | 2 |
| 41 | Georgia Tech | 71.5 | 2 |
| 42 | Kentucky | 71.5 | 2 |
| 43 | Wisconsin | 71.5 | 2 |
| 44 | Boise State | 71.5 | 3.5 |
| 45 | Minnesota | 71 | 2.5 |
| 46 | UCLA | 71 | 1.5 |
| 47 | Arkansas | 70.5 | 1.5 |
| 48 | Mississippi State | 70.5 | 2 |
| 49 | North Carolina State | 70.5 | 2.5 |
| 50 | Baylor | 70.5 | 1.5 |
| 51 | Oklahoma State | 70.5 | 2 |
| 52 | Kansas | 69.5 | 2.5 |
| 53 | Northwestern | 69.5 | 1.5 |
| 54 | Duke | 69 | 2.5 |
| 55 | Wake Forest | 69 | 2 |
| 56 | Cincinnati | 68.5 | 1.5 |
| 57 | Maryland | 68.5 | 2 |
| 58 | California | 68.5 | 2 |
| 59 | West Virginia | 68 | 2 |
| 60 | UCF | 68 | 2 |
| 61 | Colorado | 67 | 2.5 |
| 62 | Rutgers | 66.5 | 2 |
| 63 | UNLV | 66.5 | 2.5 |
| 64 | North Carolina | 66 | 2 |
| 65 | Navy | 66 | 2.5 |
| 66 | Michigan State | 66 | 1.5 |
| 67 | Iowa State | 65.5 | 2.5 |
| 68 | San Diego State | 65.5 | 2 |
| 69 | Syracuse | 65.5 | 2.5 |
| 70 | Fresno State | 65 | 2 |
| 71 | UTSA | 65 | 3.5 |
| 72 | James Madison | 64.5 | 3.5 |
| 73 | Tulane | 64.5 | 2.5 |
| 74 | South Florida | 64.5 | 3 |
| 75 | Memphis | 64 | 2.5 |
| 76 | New Mexico | 64 | 2 |
| 77 | Purdue | 64 | 1 |
| 78 | East Carolina | 63.5 | 2 |
| 79 | Stanford | 63.5 | 1.5 |
| 80 | Army | 63 | 2.5 |
| 81 | North Dakota State | 62 | 3.5 |
| 82 | Texas State | 62 | 2 |
| 83 | Boston College | 62 | 2 |
| 84 | Old Dominion | 61.5 | 1.5 |
| 85 | Hawai’i | 61.5 | 3 |
| 86 | Washington State | 61.5 | 3 |
| 87 | Air Force | 60.5 | 2 |
| 88 | Western Michigan | 60 | 3.5 |
| 89 | Utah State | 59.5 | 3 |
| 90 | Western Kentucky | 59.5 | 3 |
| 91 | Miami (Ohio) | 59 | 3.5 |
| 92 | Liberty | 59 | 2.5 |
| 93 | Toledo | 58.5 | 3.5 |
| 94 | Troy | 58.5 | 3 |
| 95 | Marshall | 58.5 | 3.5 |
| 96 | North Texas | 57.5 | 2.5 |
| 97 | Florida Atlantic | 57.5 | 1.5 |
| 98 | Jacksonville State | 57.5 | 3.5 |
| 99 | Temple | 57 | 2 |
| 100 | Louisiana-Lafayette | 57 | 2 |
| 101 | Tulsa | 56.5 | 1 |
| 102 | Arkansas State | 56.5 | 2.5 |
| 103 | Oregon State | 56.5 | 3.5 |
| 104 | Louisiana Tech | 56.5 | 2 |
| 105 | Georgia Southern | 56 | 3.5 |
| 106 | Kennesaw State | 55.5 | 2.5 |
| 107 | Delaware | 55.5 | 1 |
| 108 | Connecticut | 55 | 3 |
| 109 | Ohio | 55 | 3.5 |
| 110 | Colorado State | 55 | 2 |
| 111 | Wyoming | 54.5 | 2 |
| 112 | Appalachian State | 54.5 | 2 |
| 113 | South Alabama | 54 | 2 |
| 114 | Central Michigan | 54 | 3 |
| 115 | Florida International | 53 | 2 |
| 116 | Nevada | 52.5 | 1 |
| 117 | Coastal Carolina | 52.5 | 2 |
| 118 | Buffalo | 52 | 2 |
| 119 | San Jose State | 51.5 | 2.5 |
| 120 | Rice | 51.5 | 3 |
| 121 | Eastern Michigan | 51.5 | 2.5 |
| 122 | Bowling Green | 50.5 | 2 |
| 123 | Missouri State | 50 | 2 |
| 124 | New Mexico State | 50 | 2.5 |
| 125 | Southern Mississippi | 49.5 | 2 |
| 126 | UAB | 49.5 | 2.5 |
| 127 | Akron | 48.5 | 2 |
| 128 | Middle Tennessee | 48.5 | 1.5 |
| 129 | Sacramento State | 48 | 2 |
| 130 | Georgia State | 48 | 1 |
| 131 | Northern Illinois | 47.5 | 1.5 |
| 132 | UTEP | 47 | 1 |
| 133 | Kent State | 46.5 | 1 |
| 134 | Louisiana-Monroe | 46 | 2 |
| 135 | Sam Houston State | 44.5 | 2 |
| 136 | Charlotte | 44.5 | 1 |
| 137 | Ball State | 44 | 3 |
| 138 | Massachusetts | 40 | 1 |
This spot will be reserved for some notes and updates on my biggest power ratings movers on a weekly basis. Early in the season, I try to hold on to my priors and the research that I did heading into the season, but there could be some very sizable adjustments coming in Weeks 3-5.
My Week 0 College Football Lines
(note: games are ordered by rotation number)
| Date | Away | Home | Line |
| 8/29 | North Carolina | TCU (N – Dublin) | -7.5 |
| New Mexico State | Florida State | -26.5 | |
| Sacramento State | Eastern Michigan | -6 | |
| Hawaii | Stanford | -3.5 | |
| San Jose State | USC | -35 | |
| Memphis | UNLV | -5 | |
| NC State | Virginia | -5 | |
| Jacksonville State | North Dakota State | -8 |
Games to consider:
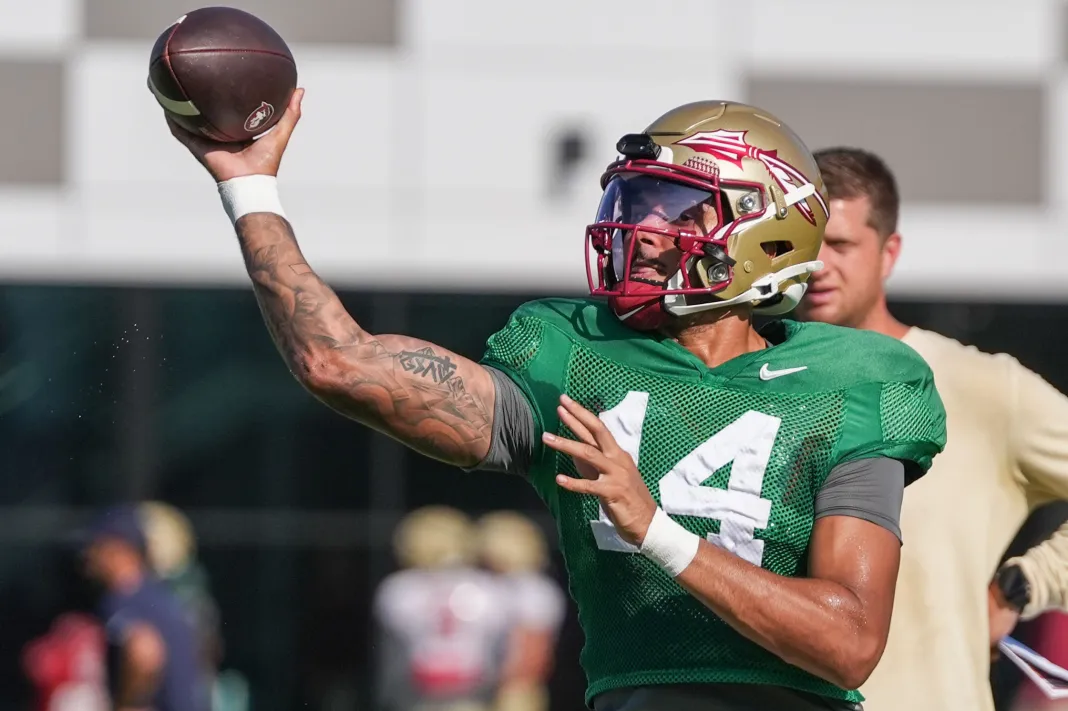
New Mexico State +31.5 (+26.5) at Florida State: I’m not an Ashton Daniels fan. In fact, I royally pissed off some Florida State fans on the College Football Betting Podcast episode about the ACC a couple of weeks ago. This is my biggest discrepancy of the week.
Sacramento State +9.5 (+6) at Eastern Michigan: I don’t think I’ll play this one because I have no idea what Sacramento State will look like, but this is a byproduct of how I am lower than the market on Eastern Michigan. They’re a fade team for me early in the season, just probably not here with the Hornets in their first FBS game a long way from home. There are 10s out there, including one at Circa at time of writing, and I’m intrigued by that. Maybe I’ll wait and see if a 10.5 or 11 shows up. I don’t think Sac State will get much love this week, so I can be patient.
We’ll fire up our regular weekly cadence on the College Football Betting Podcast next week, but I’ll be on every Monday to discuss some things about my power ratings, fire off some more hot takes so other fan bases can hate me, and give you an early look at my thoughts on the games, especially when we have weeknight action.
I’ll be posting this weekly Power Ratings update all season long, including my lines on the games. Keep it locked in right here at VSiN and bookmark our weekly College Football Hub to get all of our written content every week during CFB season.