
Hello,
Swing into the season: Get expert analysis, live odds, and predictions
2026 MLB Betting Guide
Select a division in the drop down to reveal team logos. Click a team card to open its 2026 preview.
Welcome to the top resource for bettors seeking the latest insights for the best MLB bets today and beyond. At VSiN, we deliver up-to-date news, articles, and detailed coverage, including MLB betting lines, Vegas Odds, National Odds, and MLB betting splits. Whether you're a seasoned bettor or just a fan, our goal is to provide you with the most current MLB odds and information so you can make the most informed MLB baseball bets. Take your betting strategies to a whole new level. Explore the links in our menu or dive into the latest articles below.

2026 MLB BETTING GUIDE
Select a division to reveal team logos. Click a team card to open its 2026 preview.
Welcome to your premier destination for MLB betting intelligence. As we head into the 2026 season - the earliest start in Major League history - the landscape of MLB baseball picks is more dynamic than ever. From the opening night showdown between the Yankees and Giants on March 25 to the final pitch of the World Series in October, VSiN provides daily MLB picks for today's games and expert MLB predictions to help you navigate the 162-game schedule.

")
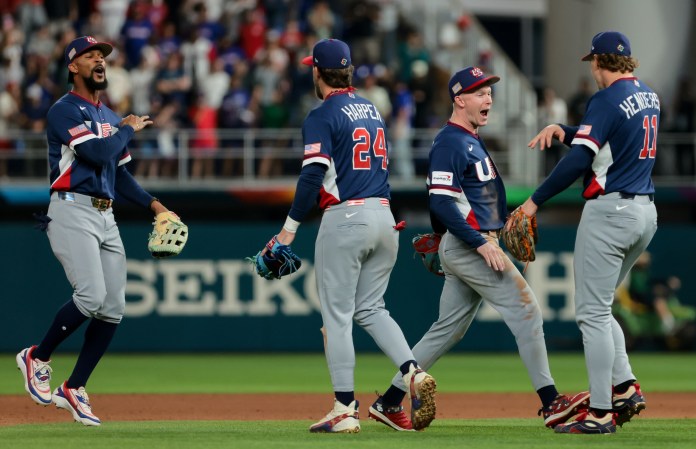
March 17, 2026
The World Baseball Classic comes to an end tonight with the championship game between Venezuela and the United States. Based on how the rosters looked,...

March 5, 2026
Spring Training friendlies are in the books and now it’s time for the real games to begin. The 2026 World Baseball Classic takes place March...
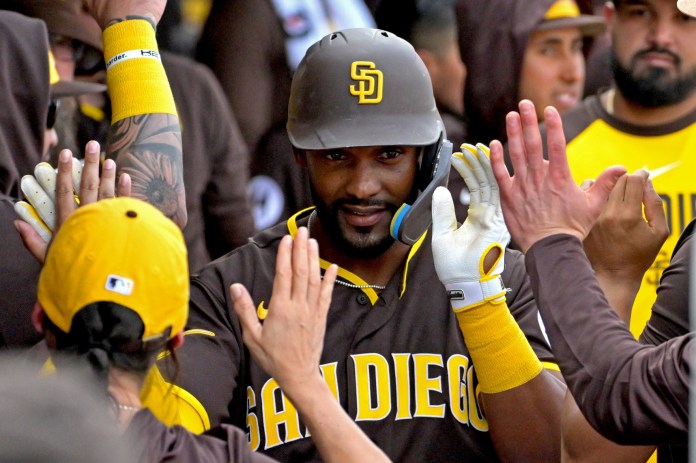
March 1, 2026
We shouldn’t be surprised that the Padres had a quiet offseason, as they finished just three games behind the stacked Dodgers and made the playoffs...
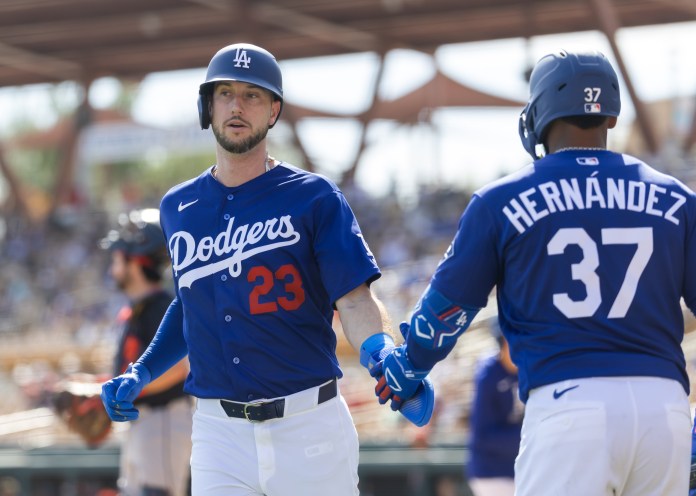
March 1, 2026
Based on what they’ve built, the Dodgers have put themselves in a position to basically coast through the regular season and employ a baseball form...
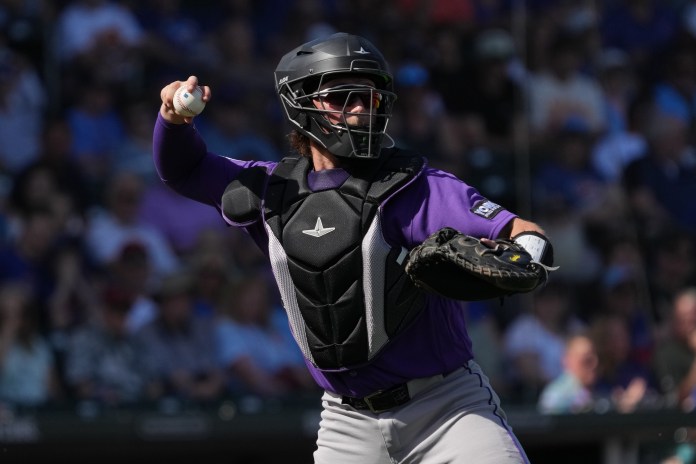
March 1, 2026
The Rockies have officially hit rock bottom. Their first 100-loss season in franchise history didn’t really come as a huge shock in 2023, but they’ve...
March 1, 2026
The inherent nature of the MLB Draft cheapens one of my longtime arguments just a little bit because picking high is never going to be...
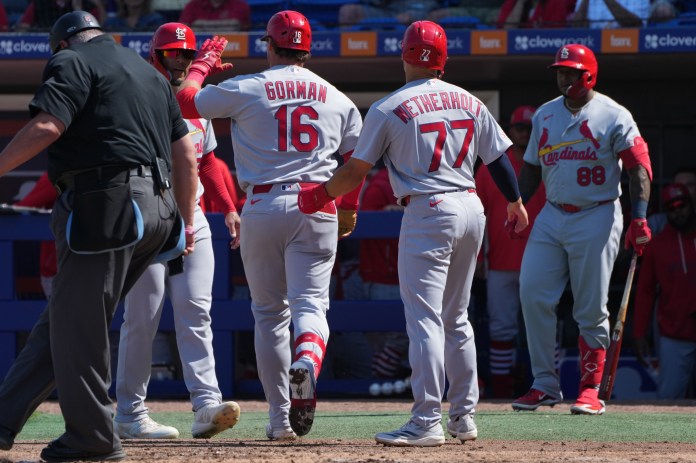
March 1, 2026
From 2000-15, the Cardinals made 12 playoff appearances and won two World Series. After a three-year hiatus, despite winning records in all three seasons, the...

March 1, 2026
The CBA negotiations are going to be rather interesting over the next several months and a team like the Pirates will be at the center...
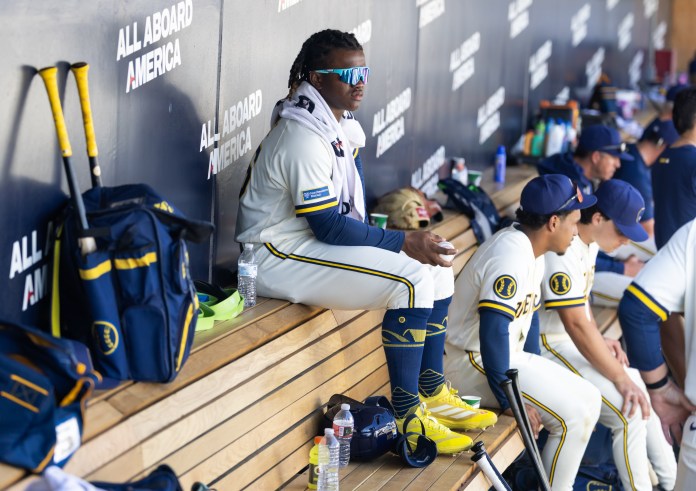
March 1, 2026
The Brewers just keep defying the odds. Per Cot’s Contracts, Milwaukee hasn’t had an Opening Day payroll in the top half of the league since...
March 1, 2026
Making the playoffs is never a bad thing, but as a diehard fan of a small-market team with a cheap owner about four hours up...
March 1, 2026
It is amazing how one season can dramatically shift a narrative. Had the Cubs not won the 2016 World Series to snap their 108-year drought,...
March 1, 2026
The 2019 season feels like an eternity ago for the Nationals. Since winning the first and only World Series in franchise history, the team has...
In a sport defined by 162 games of data, our MLB picks stand out by focusing on situational edges and bullpen depth. Every morning, we update our MLB picks today to account for late-breaking lineup changes, umpire assignments and factors like weather and wind that drastically influence scoring.
Whether you are looking for MLB best bets on the moneyline or exploring the increasingly popular YRFI (Yes Run First Inning) and NFRI (No Run First Inning) markets, our analysts break down the starting pitcher matchups that dictate the odds. As Pennant races heat up in August and September, our daily picks shift to identify teams with “playoff urgency” versus those looking toward next season, ensuring your MLB bets are always backed by current motivation.
Success in baseball betting requires looking past the box score. Our MLB predictions for today leverage advanced metrics like Barrel Rate, Hard-Hit percentage and xERA to find discrepancies in the betting market.
As the schedule moves toward the All-Star Game in Philadelphia on July 14, 2026, our MLB predictions provide deep dives into player performance trends. We offer specialized analysis for the Home Run Derby, identifying which sluggers’ swing planes are best suited for the dimensions of Citizens Bank Park. By combining traditional scouting with modern sabermetrics, our MLB predictions offer a level of detail that generic sports sites can’t match.
The road to the 2026 World Series begins long before the first pitch of the MLB Playoffs on September 29. Throughout the summer, we monitor the Pennant Races in the AL and NL, providing specialized MLB betting lines for divisional winners and Wild Card spots. If you’re looking for a sleeper to win the Fall Classic, our World Series predictions analyze farm system depth and potential trade deadline acquisitions to find long-shot value before the market adjusts.
When the calendar turns to October, the game changes. MLB playoff betting requires a different handicap, focusing on elite starting pitching rotations and high-leverage relief arms. Our MLB predictions for the postseason take you through every round, from the Wild Card Series to the World Series.
During the playoffs, we provide specialized MLB picks for “Series Prices” and “Game-by-Game” adjustments. Because the margins are so thin in October, our MLB betting guides emphasize the importance of specific metrics and managerial tendencies. Trust VSiN to keep you informed through every high-stakes moment of the 2026 MLB season.