
Hello,
Swing into the season: Get expert analysis, live odds, and predictions
2026 MLB Betting Guide
Select a division in the drop down to reveal team logos. Click a team card to open its 2026 preview.
Welcome to the top resource for bettors seeking the latest insights for the best MLB bets today and beyond. At VSiN, we deliver up-to-date news, articles, and detailed coverage, including MLB betting lines, Vegas Odds, National Odds, and MLB betting splits. Whether you're a seasoned bettor or just a fan, our goal is to provide you with the most current MLB odds and information so you can make the most informed MLB baseball bets. Take your betting strategies to a whole new level. Explore the links in our menu or dive into the latest articles below.

2026 MLB BETTING GUIDE
Select a division to reveal team logos. Click a team card to open its 2026 preview.
Welcome to the top resource for bettors seeking the latest insights for the best MLB bets today and beyond. At VSiN, we deliver up-to-date news, articles, and detailed coverage, including MLB betting lines, Vegas Odds, National Odds, and MLB betting splits. Whether you're a seasoned bettor or just a fan, our goal is to provide you with the most current MLB odds and information so you can make the most informed MLB baseball bets. Take your betting strategies to a whole new level. Explore the links in our menu or dive into the latest articles below.

")
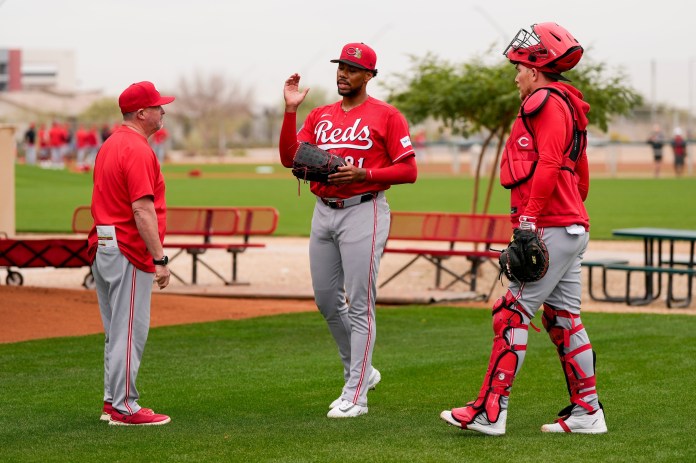
March 1, 2026
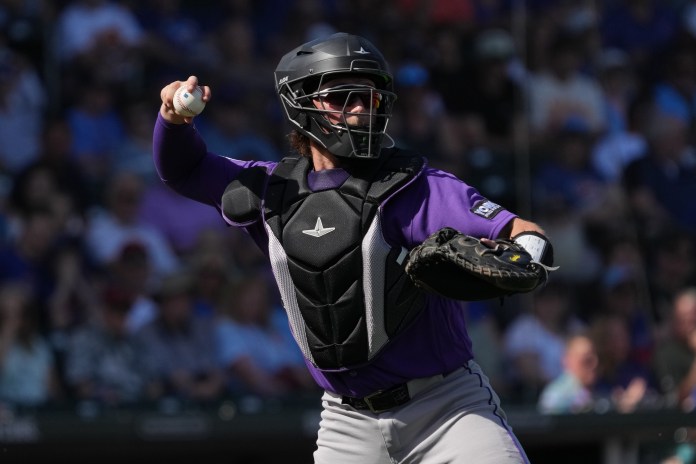
The Rockies have officially hit rock bottom. Their first 100-loss season in franchise history didn’t really come as a huge shock in 2023, but they’ve...
March 1, 2026
The inherent nature of the MLB Draft cheapens one of my longtime arguments just a little bit because picking high is never going to be...
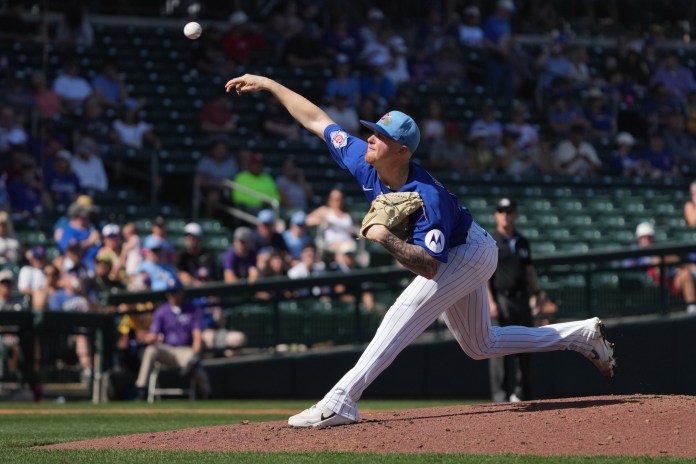
March 1, 2026
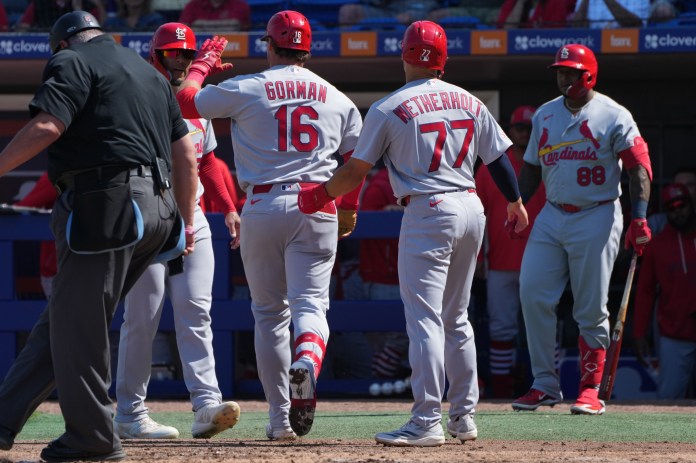
From 2000-15, the Cardinals made 12 playoff appearances and won two World Series. After a three-year hiatus, despite winning records in all three seasons, the...

March 1, 2026
The CBA negotiations are going to be rather interesting over the next several months and a team like the Pirates will be at the center...
March 1, 2026
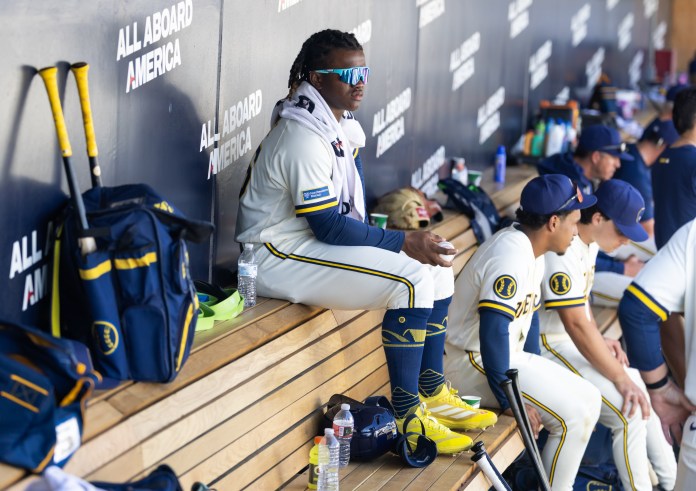
The Brewers just keep defying the odds. Per Cot’s Contracts, Milwaukee hasn’t had an Opening Day payroll in the top half of the league since...
March 1, 2026
Making the playoffs is never a bad thing, but as a diehard fan of a small-market team with a cheap owner about four hours up...
March 1, 2026
It is amazing how one season can dramatically shift a narrative. Had the Cubs not won the 2016 World Series to snap their 108-year drought,...
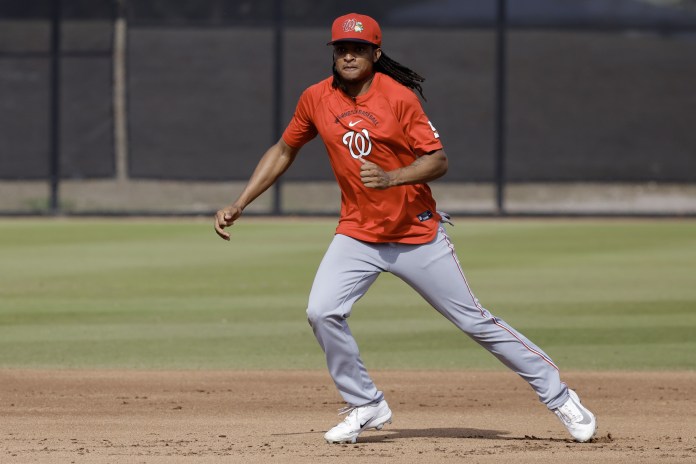
March 1, 2026
The 2019 season feels like an eternity ago for the Nationals. Since winning the first and only World Series in franchise history, the team has...
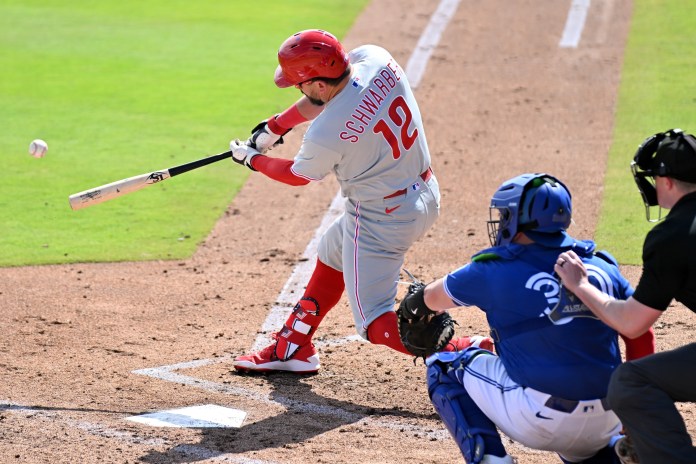
March 1, 2026
The Phillies wrapped up another strong regular season with another premature playoff exit. The 96 wins racked up by Philadelphia were the most since 2011...
March 1, 2026
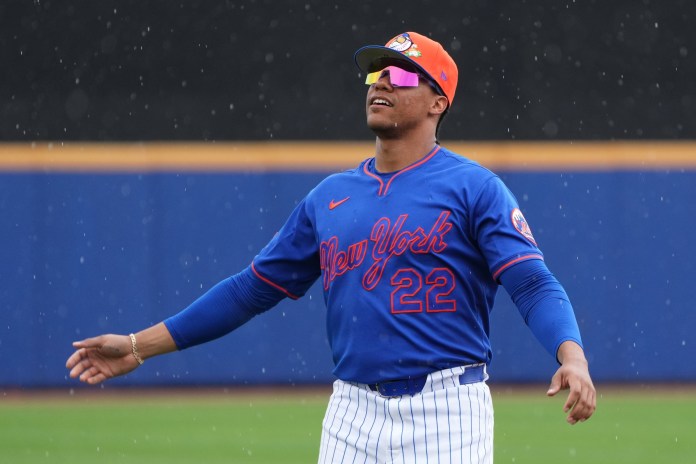
For all of the resources, all of the great pitchers and position players, and the all-in nature of what owner Steven Cohen is pursuing, the...
March 1, 2026
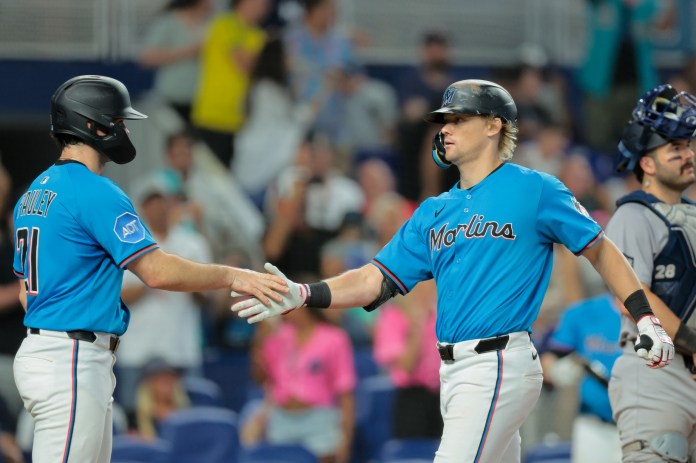
The Marlins bottomed out in 2024 when they went 62-100, as there were a ton of things going on within the organization. It started well...
March 1, 2026
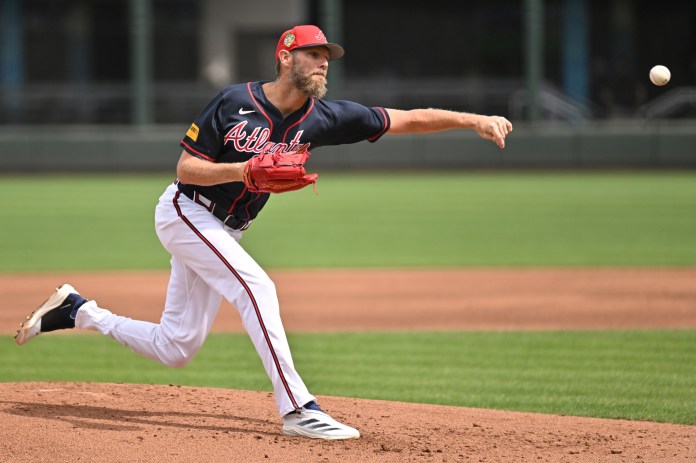
Things have changed, but they’ve also kind of stayed the same for the Braves. Ex-manager Brian Snitker was forced out/stepped down after the season and...