
Hello,
Welcome to the VSiN NBA betting headquarters. As the 2025-26 regular season wraps up on April 12, the intensity on the hardwood is reaching its peak. Whether you're hunting for NBA picks for today's games to pad your bankroll, looking for deep-value NBA predictions for the 2026 NBA Playoffs or looking to stay ahead of the curve during the NBA Drafts, our experts provide the analytical edge you need. From the high-stakes SoFi Play-In Tournament to the crowning of a new king in the NBA Finals this June, VSiN is your home for sharp basketball insights.

June 21, 2026
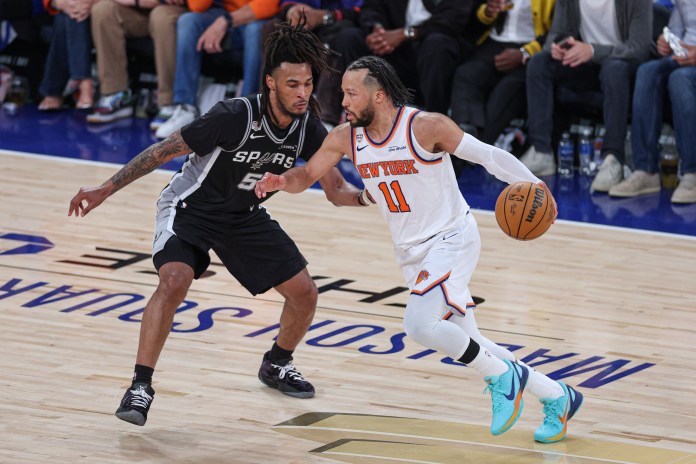
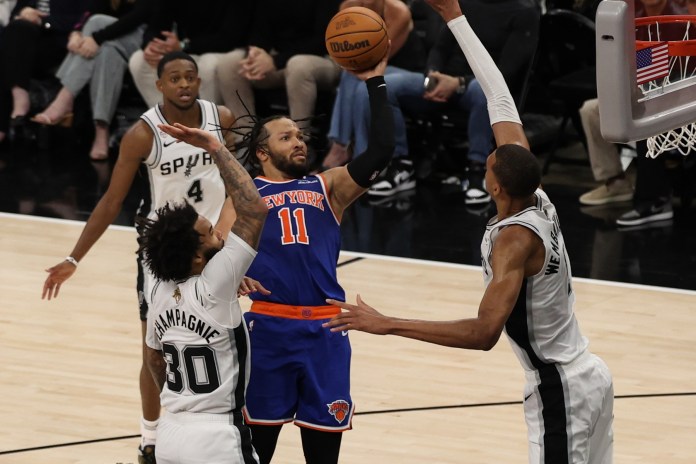
The 2025-26 NBA season is officially over. The New York Knicks defeated the San Antonio Spurs in an exciting five-game series, and the fresh blood...
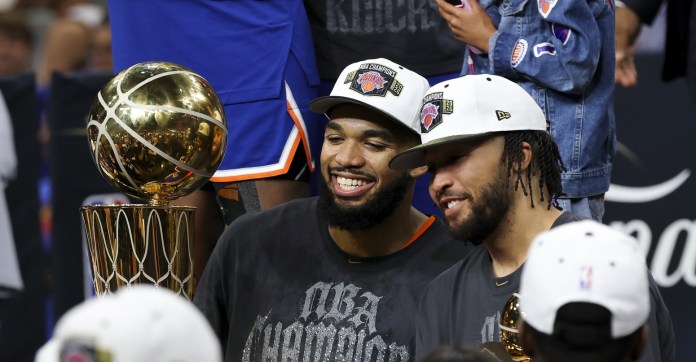
June 13, 2026
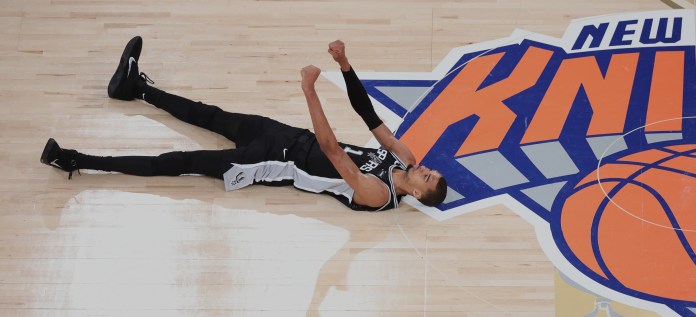
This will go down as the most dramatic NBA Finals . . . that only lasted five games. Thanks to a remarkable postseason run, the...
June 12, 2026
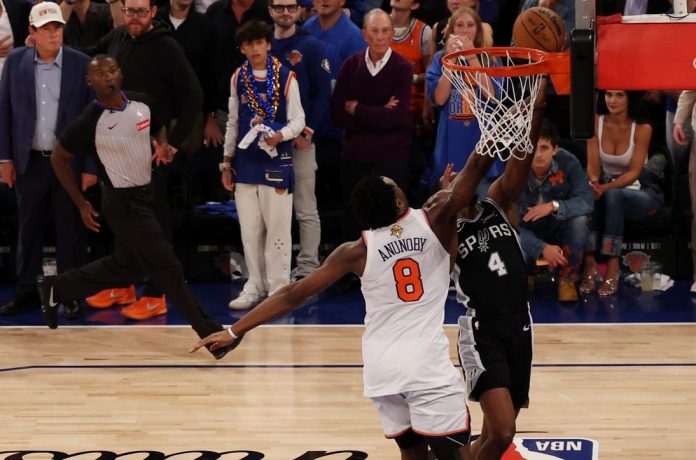
Knicks vs. Spurs Game 5 Pick, Prediction, Odds On Saturday, June 13, the San Antonio Spurs look to rebound from the biggest collapse in NBA...
June 12, 2026
Today’s NBA Betting Trends: The following NBA betting trends are a collection of analytical data, betting systems and strength ratings featured on VSiN and qualified...
June 10, 2026
The World Cup begins today. And according to CNBC’s Contessa Brewer, it could become the biggest sports betting event in history. 👉 Why the World...
June 10, 2026
Today’s NBA Betting Trends: The following NBA betting trends are a collection of analytical data, betting systems and strength ratings featured on VSiN and qualified...
June 9, 2026
The World Cup starts tomorrow. If you’ve been meaning to enter the Splash Sports $1 million World Cup Survivor contest, your window is closing. It’s...
June 9, 2026
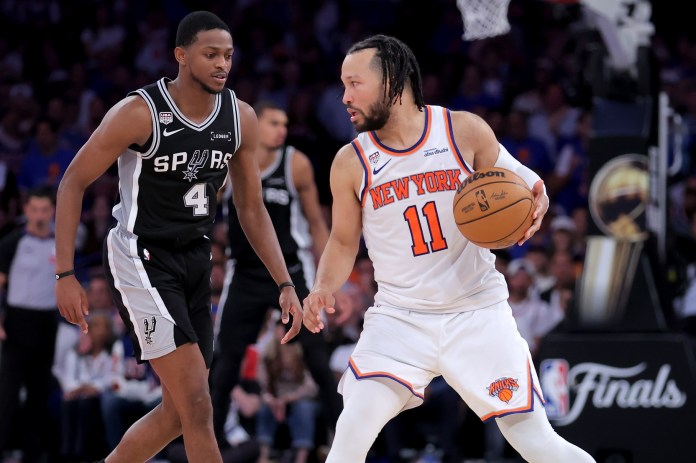
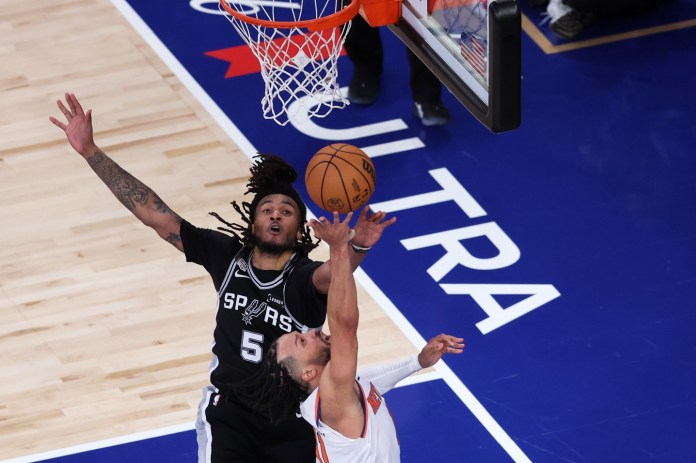
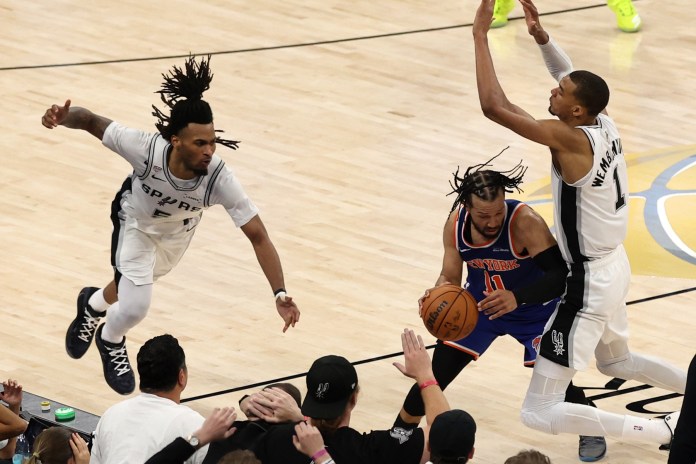
Spurs vs. Knicks Game 4 Pick, Prediction, Odds The energy in Madison Square Garden will be a bit different on Wednesday, June 10. In Game...
June 9, 2026
We know this much: There will be a Game 5 in the NBA Finals. The Spurs made sure of that Monday night. San Antonio beat...
June 8, 2026
Today’s NBA Betting Trends: The following NBA betting trends are a collection of analytical data, betting systems and strength ratings featured on VSiN and qualified...
June 7, 2026
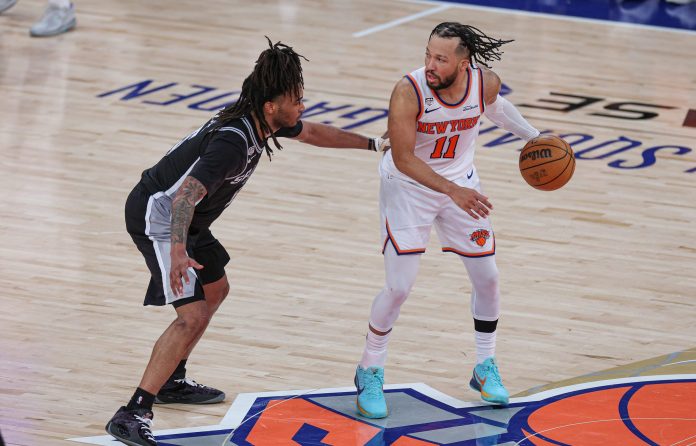
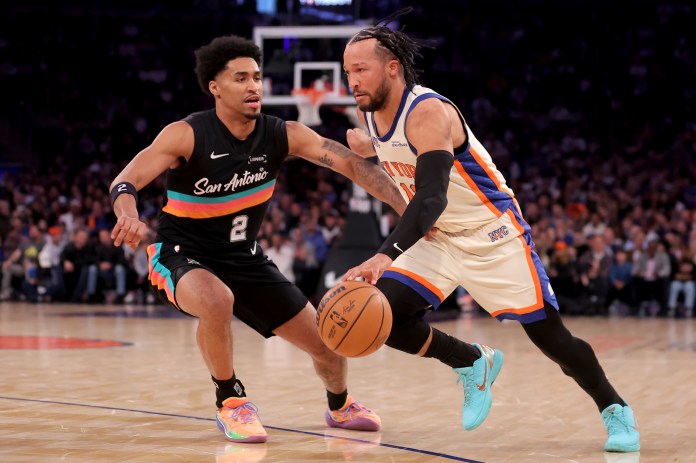
The Knicks have won 13 playoff games in a row and are 12-1 against the spread during that run. They have beaten the Spurs twice...
June 6, 2026
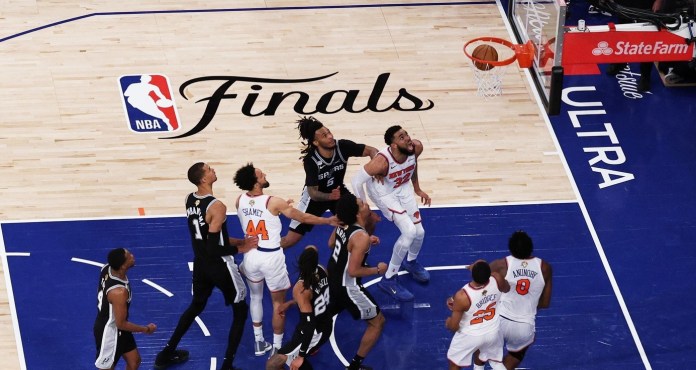
NBA Finals Betting Trends: In recent weeks on VSiN.com, I have unveiled some of the best betting systems and trends for the earlier rounds of...
Our daily NBA picks are designed to cut through the noise by focusing on load management updates, shooting regressions and officiating tendencies. Every morning, we refresh our NBA picks today to ensure you have the most accurate information before the lines move.
In the final weeks of the season, our NBA best bets prioritize teams fighting for guaranteed playoff spots versus those already locked into the lottery. We don’t just provide a spread; we analyze the “clutch” metrics that determine winners in the final two minutes. If you’re looking for NBA picks for today, look no further than our daily breakdown of totals, player props and moneyline value.
Success in betting professional basketball requires a blend of traditional scouting and advanced analytics. As we look toward the NBA Playoffs starting April 18, our NBA predictions shift to “Series Prices” and tactical coaching adjustments. We analyze how superstars like Victor Wembanyama or Shai Gilgeous-Alexander perform when defenses tighten in a seven-game series. Check back daily for NBA predictions that go beyond the box score to give you a true professional’s perspective on every matchup.
The road to the Larry O’Brien Trophy is officially open. Our futures hub tracks the 2026 NBA Championship odds in real-time, identifying which contenders are peaking at the right time. With the NBA Finals set to tip off on June 3, 2026, identifying early value in the Eastern and Western Conference markets is essential.
We provide specialized coverage of the NBA Playoff Bracket, offering NBA predictions on potential sleepers in the first round. Whether you are betting on a repeat champion or a first-time winner, our analysis of roster depth and playoff experience will guide your NBA bets through every round of the postseason.
Betting on the NBA Playoffs is a different beast than the regular season. Rotations shorten and defensive intensity skyrockets. Stay tuned to VSiN for exclusive betting splits and future trends that will keep you ahead of the curve all the way through the NBA Championship.