

Super Bowl Betting Trends & Systems
With this year’s Super Bowl game being the 58th in the history of the National Football League, a sample size of 57 previous games can lead us to definitive trends and patterns that have formed. All of which can help us to project how the upcoming matchup might play out.
I recently read a quote on Google that said: “Without big data analytics, companies are blind and deaf, wandering out onto the web like deer on a freeway”. As the Director of Analytics at VSiN and an avid sports bettor, I feel the exact same way.
***Top NFL Resources***
*Join thousands of other sports bettors and unlock access to picks, public betting spits data, & the VSiN live video broadcast by upgrading to VSiN Pro. Grab your first month for less than $10.*
- NFL Expert Picks
- NFL Betting Hub
- NFL 2024 Week-By-Week Schedule
- Parlay Calculator
- NFL Betting Splits
- NFL Betting Odds
Here are a few notable Super Bowl trends and systems:
Super Bowl Game Stat Angles
Rushing yards, passing yards per attempt, turnovers, and time of possession are four key statistical categories that I have found to have a great impact on who has been the Super Bowl winners. The following trends demonstrate the importance of these statistics.
- Teams that rush for more yards in the Super Bowl are 42-15 SU & 40-14-3 ATS (74.1%). The Chiefs outrushed the Eagles last February, 158-115.
- Teams that average more passing yards per attempt in the NFL title game are 44-13 SU & 37-17-3 ATS (68.5%). This one actually lost last year as the Eagles and QB Jalen Hurts outgained Mahomes and the Chiefs in this category, 8.0-6.7.
- In the 45 previous Super Bowls in which there was a turnover advantage for either team, the team that had fewer turnovers has lost just eight times, going 35-9-1 ATS (79.5%). Strangely, two of those outright losses came in the last two years, as the Chiefs wound up being on the favorable end of a 1-0 turnover decision.
- Teams that win the time of possession battle are 41-16 SU & 39-15-3 ATS (72.2%) in the history of the Super Bowl, but the Eagles were the latest to lose on that edge, holding the ball for about 11.5 minutes longer than Kansas City.
- Teams that hold an edge in at least three of these four key statistical categories are 40-6 SU & 36-9-1 ATS (80%). AMAZINGLY, four of those outright losses were in the last nine games, including last year.
- Teams that win all four categories are 26-0 SU & 24-1-1 ATS (96%). The only ATS loss occurred in Super Bowl XXXIX in Philadelphia’s ATS win versus the Patriots.
The Buccaneers were the last team to sweep the four categories in SB55 and won handily. In last year’s game, the Eagles actually claimed three of the four categories but lost, demonstrating how confounding the Chiefs win actually turned out to be.
In-Game Scoring Trends
- In terms of scoring, the average winning score is 30.1 PPG, with the average losing score being 16.4 PPG, an average winning margin of 13.7 PPG. However, interestingly, 18 of the last 20 games have been decided by 14 points or less, a continuing sign of a much more competitive era in the NFL. One of those two blowouts was of course in 2021. This year’s game and its tight point spread again points to a competitive game.
- The Giants of 2008 were the first team in 33 years to win the Super Bowl without hitting the 20-point mark. The Patriots did it again in 2019 with the lowest winning point total ever, 13 points.
- Since the epic 35-31 duel between Pittsburgh and Dallas in Super Bowl XIII in 1979, there have been 28 teams to hit the 30-point mark in this game, their record: 25-3 SU & 24-4 ATS. Of course, last year, Philadelphia put up 35 points, the most ever for a losing team.
- There have been 22 previous Super Bowl teams that have failed to reach the 14-point mark. Their record…1-21 SU & ATS (4.5%). This is another trend illustrating just how improbable the Patriots’ 2019 win was.
- More on the recent competitiveness of the game: Of the only 18 games to be decided by less than a touchdown, half of them have been in the last 16 years.
ATS and Money Line Trends
- Favorites in the Super Bowl are 35-21 SU but own an ATS mark of 25-28-3 (47.2%), with the 1982 game having been a pick ‘em point spread. However, over the past 22 years, underdogs own a 16-6 ATS (72.7%) edge, including 12-4 ATS in the L16. Kansas City pulled the outright upset last year as 1.5-point underdogs, 38-35.
- Favorites of a touchdown or more are 3-2 SU but 0-4-1 ATS (0%) since the millennium. Still, there hasn’t been a favorite of that magnitude since the Patriots in 2008.
- The straight up winner is 47-7-3 ATS (87%) in the 57 previous Super Bowls. This is the highest mark of any playoff round. Interestingly, one of those ATS losses did occur in ‘22 as Cincinnati became the first underdog to cover a point spread without winning on a Super Bowl line of less than 6. The general thought is that champions typically leave little doubt in this game.
- The NFC owns a slight 29-28 outright lead, and maintains a 28-26-3 (51.9%) ATS edge all time. However, AFC teams are 7-3 ATS in L10.
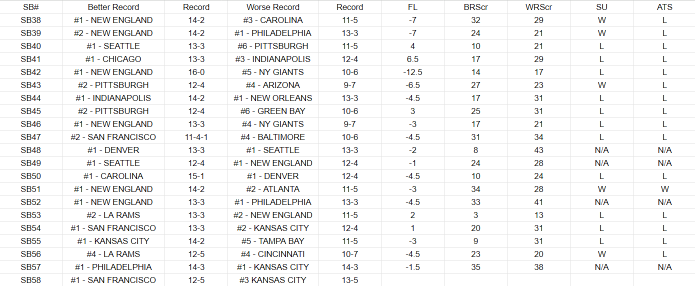
- The team that is the better playoff seed is just 2-15-2 ATS (11.8%) in the last 26 Super Bowl games! Note, in 2011, 2014, 2015, 2016, 2018, 2019, 2022, & 2023, equal seeds matched up.
- The team with the better record going into the Super Bowl game is 30-19 SU all-time, but has lost 11 of the L13, and is on a 1-15 ATS skid since ’04, including the Rams (12-5) ATS loss to the Bengals (10-7) in ‘22. New England’s epic comeback against Atlanta in the 2017 game was the only ATS win. This trend was not in play last season, but will be here.
Over/Under Trends
- Overall, in the 55 Super Bowl games that have had totals, the results are nearly split 28 Overs, 27 Unders, 1 push. Prior to the ’23 Over, the most recent four had gone Under, the first time there was that much of an Under streak since the four straight in ’05-‘08. The 2023 game went Over by 21.5 points, the biggest margin on that wagering option since Philadelphia beat New England 41-33 in 2018 on a total of 49.
- There has been 46.5 PPG scored in the Super Bowl, on posted totals averaging 45.0. However, the early years’ totals were often in the 30’s, dragging that number down significantly. More recently, the last 19 years have seen an average posted total of 50, with 47.7 PPG scored. Eleven of the 19 games in that era went Under.
- The ’23 Super Bowl was one of only 19 in history that saw both teams reach the 20-point mark. Fifteen of those were Overs.
Keep it right here at VSiN.com for more Super Bowl betting trends and systems, including those that are specific to Super Bowl LVIII between the Kansas City Chiefs and San Francisco 49ers.


