
Hello,
If you're a fan of making NHL hockey bets, VSiN is your destination for the best NHL betting picks and expert analysis. Get comprehensive information to help you make informed betting decisions, stay up-to-date with the latest NHL odds and betting lines, and uncover trends and predictions for upcoming matchups - essential tools for sports bettors and fantasy hockey fans alike. Elevate your NHL betting strategies with our extensive coverage. Dive in now and elevate your game by checking out the links above or reading the latest articles below.
February 25, 2026
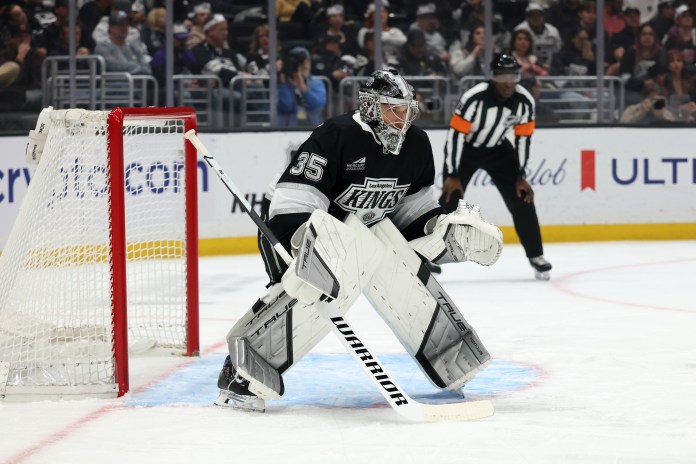
NHL Predictions and Best Bets: The NHL season resumes tonight with 28 of the 32 teams in action. If last season is any indication, we...

February 24, 2026
NHL Post-Olympics Futures Best Bets: The NHL season resumes on Wednesday with 28 of the 32 teams in action. If last season is any indication,...
February 24, 2026
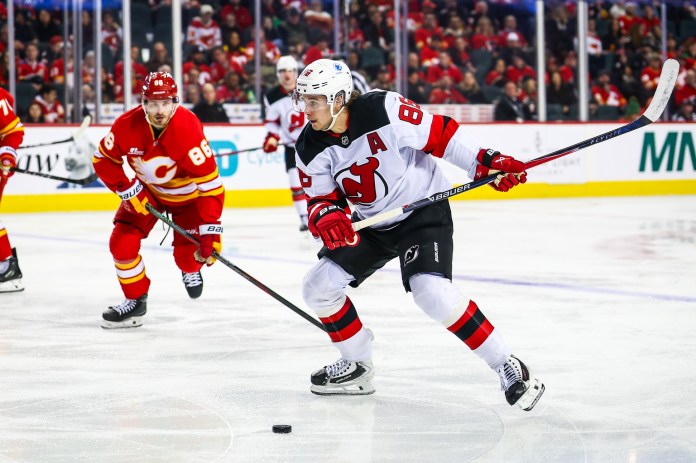
NHL Regular Season Schedule Betting Opportunities: With the hockey and overall sports world still abuzz from the Olympic Games, bettors are now more revved up...

February 24, 2026
The NHL’s Olympic reset The NHL resumes tonight, and with fewer than two months until the April 16 regular-season finale, the betting calendar is about...
February 21, 2026
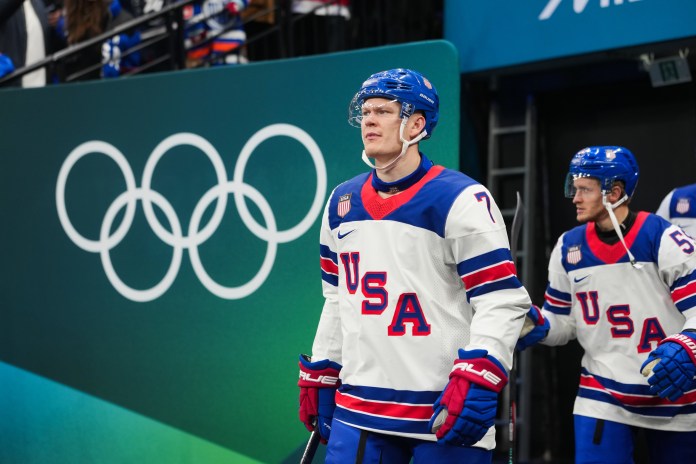
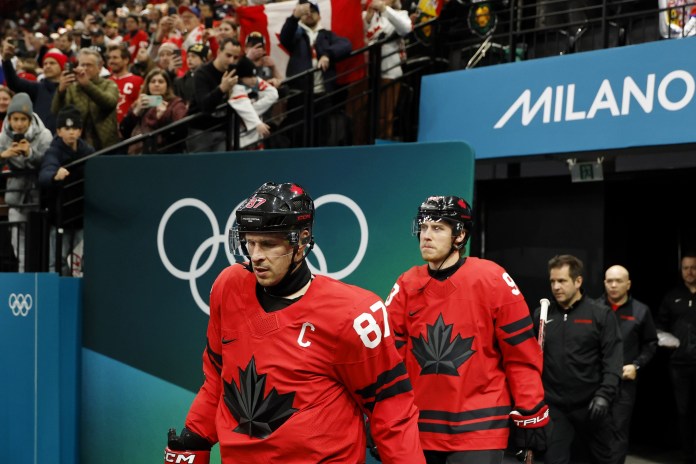
Olympic Hockey Predictions and Best Bets: Here are my picks for Sunday’s Olympic Hockey Gold Medal game. USA vs. Canada USA (+102) vs Canada (-122)...
February 19, 2026
Are we headed for the gold medal matchup everyone has circled since the Olympic men’s tournament began — USA vs. Canada? We’ll get our answer...
February 19, 2026
Olympic Hockey Predictions and Best Bets: Here are my picks for Friday’s Olympic Hockey action. Finland vs. Canada Finland (+1.5, +116) vs Canada (-1.5, -142)...

February 17, 2026
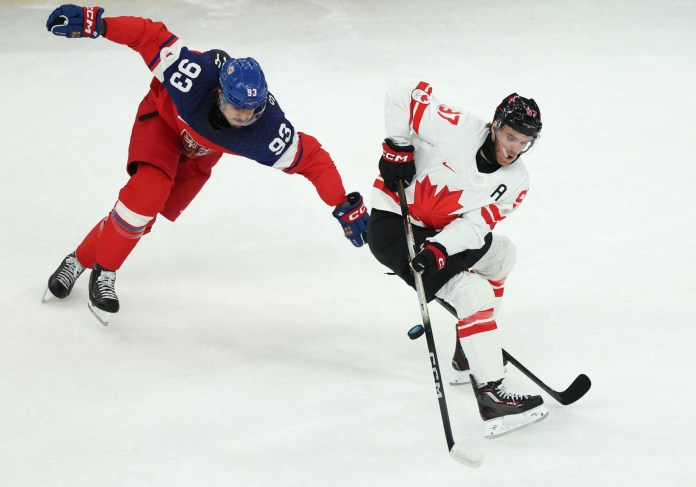
Olympic Hockey Predictions and Best Bets: Here are my picks for Wednesday’s Olympic Hockey action. Canada vs. Czechia 7:40 am ET Canada (-3.5, +120) vs....
February 16, 2026
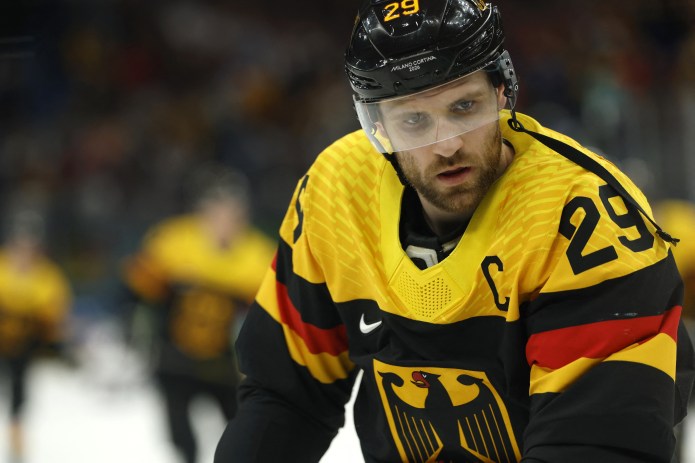
Olympic Hockey Predictions and Best Bets: Here are my picks for Tuesday’s Olympic Hockey action. Germany vs. France Germany (-3,+105) vs France (+3, -140) –...
February 14, 2026
Olympic Hockey Predictions and Best Bets: Here are my picks for Sunday’s Olympic Hockey action. Switzerland (1-1) vs Czechia (1-1) Switzerland (+120) vs Czechia (-142)...
February 13, 2026
Olympic Hockey Predictions and Best Bets: Here are my picks for Saturday’s Olympic Hockey action. Sweden (1-1) vs Slovakia (2-0) Sweden (-2.5, -118) vs Slovakia...
February 13, 2026
Olympic Hockey Predictions and Best Bets: Here are my picks for Friday’s Olympic Hockey action. Sweden vs. Finland Sweden (-1.5, +140) vs Finland (+1.5, -166)...