Cook Out 400 Predictions: Top 5 Picks and Best Long Shots:
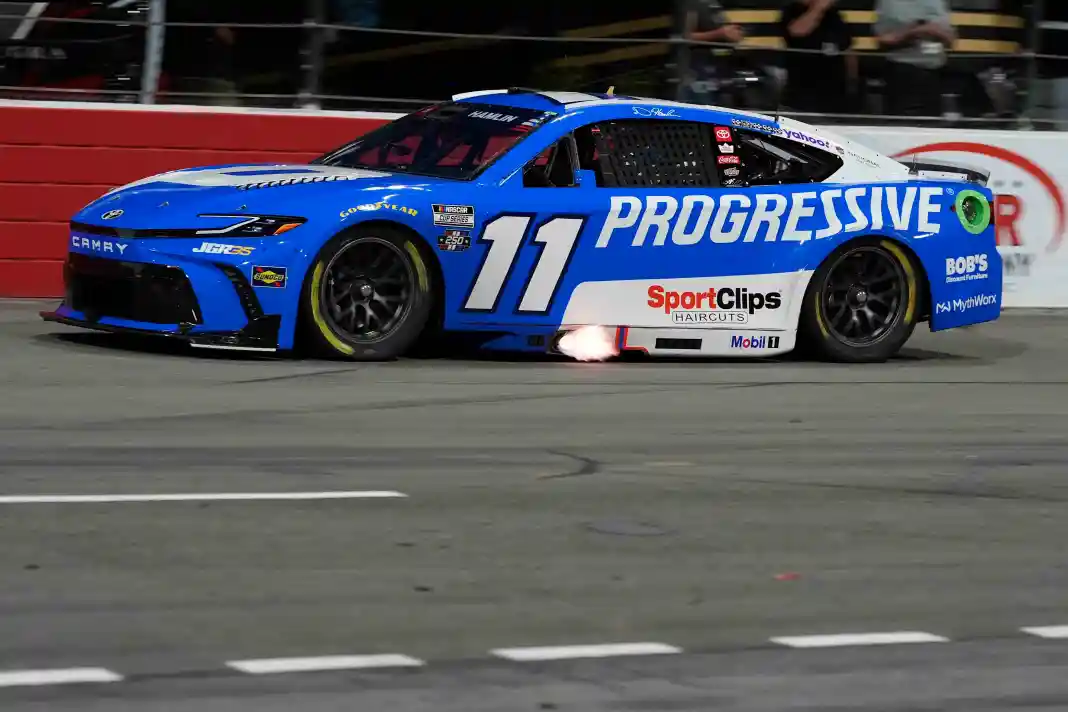
We got ourselves another underdog winner this past week at Iowa Speedway, as Ty Gibbs, third on my simulation and one of my top underdogs to consider, brought home the checkered flag at 10-1 odds. It was a pretty strong week overall for the projections, as I will show in a bit, even though Ryan Blaney, the heavy favorite, slipped to third eventually after dominating the early part of the race. Iowa had a B+ handicap-ability grade on my scale, which leads us into our next race at the track with the highest handicap-ability grade of A: Richmond Raceway. Saturday’s Cook Out 400 at RIR is one that I have had circled all season long, as this is the only visit of the season to the track with the most predictable simulations in recent years. Hopefully we can all take advantage, and with that in mind, I certainly wouldn’t discount sim favorite and Virginia native Denny Hamlin’s chances to reach Victory Lane.
As I indicated last week, flat short tracks have proven to be the most predictable venues overall for betting races based upon stats and my simulation formulas. Richmond has been the best of the bunch. The Cup Series used to visit here twice, much to our benefit, but now RIR is given just a single event. It is a 0.75-mile, 14-degree banked, D-shaped oval, and it is thought to be most similar to tracks like Iowa and Phoenix. Does the fact that we just visited Iowa factor into our handicapping this week? Well, it should, and if so, expect guys like Gibbs, Christopher Bell, Ryan Blaney, and of course, Hamlin, to be top contenders. You will see below that each of those drivers boasts some strong stat indicators to lead us to believe they will fare well on Saturday night. Those setting the odds at DraftKings certainly have their eyes on those four. Of course, don’t look past Joey Logano or two-time Richmond defending champion Austin Dillon as potential top wagering choices as well.
We are coming up fast on the cutoff point for the 2026 playoffs, otherwise known again as the Chase. The TV broadcasts for the next few races are going to focus hard on that as drivers like 15th-place Shane Van Gisbergen and 16th-place Austin Cindric look to hold off the nearest contenders, who are currently Ryan Preece, Ross Chastain, Brad Keselowski, and Erik Jones. Chastain and Keselowski have been particular disappointments this season, as both were expected to be certain playoff contenders. The reason I bring this up is that just because the coverage will focus on these drivers, bettors should be wary of backing these guys, as desperation doesn’t always equal success. In fact, just like teams in other sports that are in “must-win” situations, things can turn out quite the opposite.
The flat short track designation gives race bettors a leg up typically on the books, but from early indications, those setting the odds at DraftKings know it, and they have set their prices accordingly based upon the drivers that have separated themselves at such tracks in 2026. In fact, the odds board for this week shows Denny Hamlin (+475) as the favorite, followed by Christopher Bell (+550), Joey Logano (+700), and Ryan Blaney (+750). Kyle Larson is next at +800, but he’s getting to the point where he’s almost unbackable, and I personally apologize for taking so long to get off his bandwagon. Things just aren’t going well for him or his three other Hendrick Motorsports teammates. Of course, if you’re wondering which simulation factors are most important at Richmond historically, they have proven to be 1) performance at Flat Short Tracks, 2) recent Richmond success, and 3) momentum. Strangely, qualifying is a distant fourth, and practice speeds are even further back in fifth. Keep that in mind, as this is the first race in a while that I might suggest getting your wagers in before Friday’s practice and qualifying sessions, as those results aren’t nearly as important as usual, yet they will still move lines.
As I mentioned earlier, things went well for our simulation and predictions last week at Iowa, and this is how the Iowa Corn 350 impacted our season numbers to date.
Initial Iowa simulation winner: Loser (-1 unit) – NOW +4.85 units for the season
Final Iowa Simulation winner: Loser (-1 unit) – NOW +37.05 units for the season
Final Iowa Simulation Top 2 drivers To Win: Two losers – total return -2 units – NOW +24.35 units for the season – Gibbs just missed in 3rd
Final simulation top 3 Iowa projections: two winners, one loser – Gibbs (+320), Blaney (+135) – total return +3.55 units – NOW +2.3 units for the season
Final simulation top 5 Iowa projections: two winners, three losers, Blaney (-160), Gibbs (+145) – total return -0.55 units – Now -23.7 units for the season
As DraftKings has apparently stopped posting Top 10 odds, which I assume because they have not done it the last five races, I am discontinuing my updating of those. For the record, we landed five top 10 finishers last week against five losers.
Now for my final personal picks, which are published each race day in the VSiN Email Newsletter.
Final simulation top 5 Iowa projections: three winners, two losers, Bell (-125), Blaney (-160), Gibbs (+145)- total return +145 units – Now -37.85 units for the season
Top Iowa Longshots to win: one winner, four losers – Gibbs (+1000) – total return +6 units – Now +8 units for the season
Favorites to struggle at Iowa: Wallace (12th), Buescher (13th), Elliott (15th), Hocevar (31st), Bowman (34th) – Now 66-for-91 for the season picking usual contending drivers to finish outside of the top 10!
This was a great showing for my top underdogs and favorites to fade sections, as I hit a race winner and a perfect 5-for-5 on drivers finishing outside of the top 10. Still, I’m very happy to be moving on to Richmond, where I’ve typically seen some of my best returns. Looking ahead to Richmond now on Saturday, I have dug out the stats for the last four races run here, and these are the leaders during that time frame in specific racing categories. I am making it a habit of limiting down the number of drivers I am looking at in these stat leaders to those most offered on the typical betting platforms:
Average Starting Position Last Four Richmond Raceway Races
1. Chase Elliott: 3.75
2. Denny Hamlin: 4.75
3. Darrell Wallace: 6.25
4. Tyler Reddick: 8
5. Alex Bowman: 11.25
6. William Byron: 11.5
…
25. Chase Briscoe: 24
26. Erik Jones: 24.75
27. Ricky Stenhouse: 25.5
28. Zane Smith: 25.67
29. Shane Van Gisbergen: 27
30. John Hunter Nemechek: 29
Average Practice Position Last Four Richmond Raceway Races
1. Chris Buescher: 8.5
2. John Hunter Nemechek: 9.33
3. Christopher Bell: 11
4. Austin Dillon: 12
5. Darrell Wallace: 12.25
6. Michael McDowell: 13
…
25. Brad Keselowski: 24.25
26. Josh Berry: 25
27. Ryan Preece: 26.75
28. Austin Cindric: 29
29. Shane Van Gisbergen: 32
30. AJ Allmendinger: 33
Average Running Position Last Four Richmond Raceway Races
1. Denny Hamlin: 7.25
2. Darrell Wallace: 7.5
3. Joey Logano: 8.25
4. Tyler Reddick: 10.5
5. Josh Berry: 10.67
6. Kyle Larson: 11.75
…
25. Ricky Stenhouse: 21.5
26. AJ Allmendinger: 22.5
27. Noah Gragson: 22.75
28. Erik Jones: 23
29. Zane Smith: 24
30. John Hunter Nemechek: 30.33
Average Laps Led Last Four Richmond Raceway Races
1. Darrell Wallace: 51.25
2. Kyle Larson: 42.5
3. Denny Hamlin: 40.25
4. Austin Dillon: 35.5
5. Christopher Bell: 32.75
6. Tyler Reddick: 32.5
…
18. William Byron: 0
19. Alex Bowman: 0
20. Ross Chastain: 0
21. Ty Gibbs: 0
22. Shane Van Gisbergen: 0
23. Chase Briscoe: 0
24. Todd Gilliland: 0
25. Ricky Stenhouse: 0
26. AJ Allmendinger: 0
27. Noah Gragson: 0
28. Erik Jones: 0
29. Zane Smith: 0
30. John Hunter Nemechek: 0
Average Driver Rating Last Four Richmond Raceway Races
1. Denny Hamlin: 113.93
2. Darrell Wallace: 105.83
3. Joey Logano: 102.18
4. Austin Dillon: 94.18
5. Tyler Reddick: 92.88
6. Josh Berry: 92.07
…
25. Noah Gragson: 56.28
26. Erik Jones: 53.78
27. Zane Smith: 53.43
28. AJ Allmendinger: 52.7
29. Ricky Stenhouse: 52.6
30. John Hunter Nemechek: 37.3
Most Average Laps Run in Top 15 in Last Four Richmond Raceway Races
1. Darrell Wallace: 367
2. Joey Logano: 360.75
3. Denny Hamlin: 356
4. Josh Berry: 333.33
5. Tyler Reddick: 320.5
6. Chase Elliott: 299.25
…
25. Noah Gragson: 87.75
26. AJ Allmendinger: 56.5
27. Erik Jones: 56.25
28. Todd Gilliland: 54
29. Zane Smith: 38
30. John Hunter Nemechek: 3.33
Best Average Finish Last Four Richmond Raceway Races
1. Denny Hamlin: 3.75
2. Joey Logano: 7.25
3. Kyle Larson: 8.75
4. Austin Dillon: 8.75
5. Brad Keselowski: 9.75
6. Josh Berry: 11
…
25. Erik Jones: 23
26. Zane Smith: 23
27. Ryan Preece: 23.25
28. AJ Allmendinger: 24.5
29. Ricky Stenhouse: 27.25
30. John Hunter Nemechek: 30.67
Of note on these stat leaders, unfamiliar front runners like Austin Dillon, Bubba Wallace, and Josh Berry show up often, while some notables like William Byron, Chase Briscoe, and Ty Gibbs haven’t even led a lap in the last four races at RIR. Gibbs is currently the hottest driver on the circuit, so we’ll see if that trend gets broken on Saturday.
With those stats in mind, my top-rated drivers at Richmond are Hamlin, Logano, Wallace, Bell, and Dillon. In terms of flat short tracks, the order is Logano, Hamlin, Gibbs, Blaney, Bell. For recent ratings, the top 5 are Gibbs, Hamlin, Blaney, Reddick, Bell. All of it goes into the making of my initial simulation, which can be seen now on the VSiN.com website by navigating under the SPORTS tab to AUTO RACING.
The final simulation will be made available Friday evening after practice & qualifying, which is set for 3:30 p.m. ET. That said, having to make my predictions at this point (which could change a bit after qualifying), I would go with the following:
Top 5: Hamlin, Bell, Wallace, Gibbs, Logano
Top underdogs to consider (+1200 or higher): Reddick, Dillon, Berry, Byron, Wallace
Favorites to struggle: Larson, Briscoe, SVG, Bowman
The 400-mile event at Richmond is set for 7:00 p.m. ET on Saturday the 15th. Be sure to visit VSiN.com for this week’s full initial simulation. This is where you’ll find the sims all season long. While there, you can click on driver links for season stats and recent results, plus get current odds, and much, much more.
SPONSORED
AUGUST YOUNG is now 21-3 (88%) this WNBA season for almost +7K, which includes an absurd 16-1 (94%) winning run for +5,760!
FULLY DOCUMENTED HERE
Young is coming off another easy winner last night as he continues to dominate the women’s pro league. Access his premium WNBA picks at Doc’s Sports with a free $60 new member account. Get your free trial here!