Cook Out Southern 500 Predictions: Top 5 Picks and Best Long Shots:
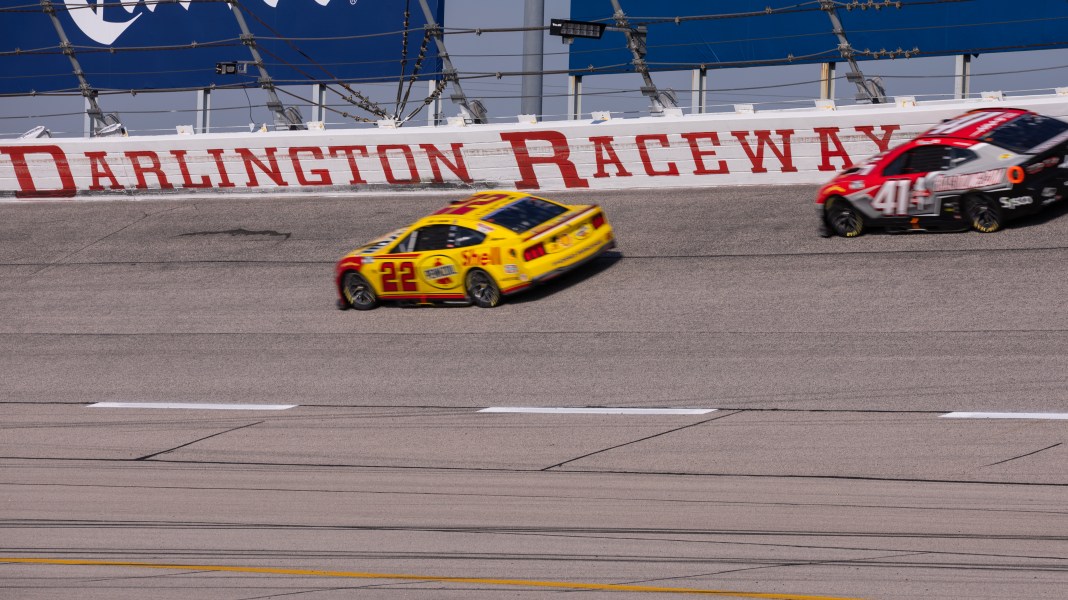
NASCAR begins its postseason this week with a trip to Darlington for the traditional Labor Day weekend event, the Cook Out Southern 500. In many ways, this is the perfect place to start the Chase, as typically there is no other track where driver skill, savvy and endurance all get tested so clearly. And this race differs from the one in the spring here each season, as it is 500 miles as opposed to 400, and those extra 100 miles can be grueling for drivers at this physical track.
Although we’ve been to mostly ovals recently, Darlington differs from all of them in that it is a 1.366-mile, egg-shaped oval that is unique on the circuit. I term it an “intermediate speedway,” and it has no similar-designation tracks currently. What makes it unique? Well, mostly its highly abrasive asphalt surface, known for causing quick tire wear, and for its four different corners, making turns treacherous. Taking 367 laps around this track is as grueling as it gets in NASCAR, physically and mentally. As such, Darlington has been given a pair of daunting nicknames that can haunt even the most experienced drivers. The first is the “Lady in Black,” due to the fact that the asphalt is black and because most cars end up leaving the track with black “Darlington Stripes” on their outside door panels from rubbing the wall coming out of turn 4. The other nickname is one that is more obvious. … the track “Too Tough to Tame.” Surviving races at Darlington with a car intact is one thing; winning is a whole other animal, and only one driver has done it more than once in the nine Next Gen races run here since 2022, that being Chase Briscoe.
Tyler Reddick won here in the spring, his fourth win in six races to start the season at the time. He eventually got another at Kansas a few weeks later but has cooled dramatically since. However, he did have a strong run at Daytona on Saturday, finishing third. That snapped a string of nine straight races finishing no better than eighth, with an average finish of 20.0. The initial simulation for this race finds him atop the projections despite the recent slump, although qualifying has the potential to change the order. Starting spot has been incredibly important at Darlington recently, as the last five winners have started first, second, third, third and second. If you’re curious, the projections call for Reddick to earn another pole. Denny Hamlin, Bubba Wallace, William Byron and Ryan Blaney could challenge for that spot, and thus the edge on the final simulation, too.
The odds board at DraftKings for the week finds Hamlin in the catbird position at +500. Like Reddick, he seems to be searching for the dominance he displayed earlier in the season, with his coming more around midseason. Reddick is next in line at +600, followed by Briscoe at +650, Kyle Larson, still in search of his first season win, at +700, and Blaney at +850. No one else is better than +1000. Not coincidentally, those are five of the top seven in the overall standings as we head into Chase race No. 1. Hamlin is currently the leader with a 25-point cushion over Blaney. He’s also a -110 favorite to win the series title, with Blaney a distant second at +550.
For the record, in terms of handicap-ability grades, Darlington gets a C+, making it one of the tracks where you can get some favorable winnings if you pick the right drivers. That is where my simulations come in.
Things went horribly last week at Daytona in the simulation, as the track clearly earned its F grade for handicap-ability, as we only scored two top-10s. With that in mind, this is how the Coke Zero Sugar 400 impacted our season numbers to date.
Initial Daytona simulation winner: Loser (-1 unit) – NOW +1.85 units for the season
Final Daytona Simulation winner: Loser (-1 unit) – NOW +34.05 units for the season (These are +89.85 units for the last two seasons!)
Final Daytona Simulation Top 2 drivers To Win: Two losers – total return -2 units – NOW +18.35 units for the season
Final Daytona Simulation Top 3 drivers To Win: Three Losers – total return -3 units – NOW +17.15 units for the season
Final simulation top 3 Daytona projections: three losers – total return -3 units – NOW -1.8 units for the season
Final simulation top 5 Daytona projections: five losers – total return -5 units – Now -29.8 units for the season
On top of all that, we only scored two top-10s. If you recall, I discontinued recording those results last month when the top-10 odds went off our feed regularly.
Now for my final personal picks, which are published each race day in the VSiN Email Newsletter…
Final simulation top 5 Daytona projections: five losers – total return -5 units – Now -48.5 units for the season
Top Daytona Longshots to win: four losers – total return -4 units – Now -4 units for the season
Favorites to struggle at Daytona Bell (17th), Elliott (23rd), Hamlin (11th), Gibbs (34th), Reddick (3rd) – Now 77 for 105 for the season picking usual contending drivers to finish outside of the top 10.
I’m proud of the “favorites to struggle” showing last week but am astounded how I overlooked Ryan Preece to win at +1800. He was my highest-rated true underdog on the simulation, projected eighth. I must have just rushed through it. Shoot.
Looking ahead to Darlington now on Sunday, I have dug out the stats for the four races that have been run at this intermediate egg-shaped asphalt oval over the last two calendar years. Typically, these tracks are all about speed, handling and managing tire wear. Pit crews are very important in a race like this as, for as grueling as the races can be, there aren’t a whole lot of cautions usually, only around seven per race over the last four, which includes two stage cautions each time out. Of the simulation factors, two have stood out more than the others in recent races: starting spot and recent Darlington performance. However, the drivers that go into Darlington with momentum typically leave with it as well; those that don’t tend to struggle. There is qualifying and practice on Saturday, and those will change things on the final simulation, although I’d be very surprised to see anyone unseat Reddick on top. Here are the stats for the last four races at Darlington for all active drivers that have raced here, with Chase Briscoe winning twice in that span:
Average STARTING POSITION last four races at Darlington
1. Darrell Wallace: 4
2. Tyler Reddick: 4.5
3. Denny Hamlin: 6.75
4. Chase Briscoe: 8
5. Kyle Larson: 8
6. William Byron: 8.25
…
25. Erik Jones: 26.25
26. Ricky Stenhouse: 29.25
27. Alex Bowman: 29.67
28. Noah Gragson: 29.75
29. Shane Van Gisbergen: 30.75
30. Connor Zilisch: 32
Average PRACTICE SPEED RANK last four races at Darlington
1. Carson Hocevar: 4.75
2. Erik Jones: 4.75
3. Connor Zilisch: 7
4. Ty Gibbs: 10
5. William Byron: 10.5
6. Ross Chastain: 11.25
…
25. Chase Elliott: 25.5
26. Alex Bowman: 26
27. Zane Smith: 26.25
28. Ryan Blaney: 27.5
29. Joey Logano: 31.5
30. Shane Van Gisbergen: 33.75
Average RUNNING POSITION last four races at Darlington
1. Tyler Reddick: 6
2. William Byron: 8.25
3. Chase Briscoe: 8.25
4. Denny Hamlin: 8.75
5. Chris Buescher: 10
6. Ty Gibbs: 11.75
…
25. Michael McDowell: 22.75
26. Connor Zilisch: 23
27. Josh Berry: 23.5
28. Shane Van Gisbergen: 24.75
29. Alex Bowman: 25
30. Ricky Stenhouse: 28.75
Average FASTEST LAPS last four races at Darlington
1. Tyler Reddick: 32
2. Chase Briscoe: 26.25
3. William Byron: 25.5
4. Denny Hamlin: 19.5
5. Ryan Blaney: 15.75
6. Kyle Larson: 15.25
…
25. Zane Smith: 1.75
26. Austin Cindric: 1.5
27. Austin Dillon: 1.5
28. Noah Gragson: 1.25
29. Connor Zilisch: 1
30. Joey Logano: 0.5
Average DRIVER RATING last four races at Darlington
1. Tyler Reddick: 119.8
2. Chase Briscoe: 107
3. Denny Hamlin: 101.88
4. William Byron: 101.75
5. Chris Buescher: 98.45
6. Darrell Wallace: 89.15
…
25. Noah Gragson: 57.03
26. Connor Zilisch: 56.2
27. Michael McDowell: 51.65
28. Shane Van Gisbergen: 51.48
29. Alex Bowman: 50.2
30. Ricky Stenhouse: 41.48
Most AVG LAPS RUN in TOP 15 last four races at Darlington
1. Tyler Reddick: 312.75
2. William Byron: 289
3. Denny Hamlin: 276.5
4. Chris Buescher: 275.75
5. Chase Briscoe: 273.5
6. Ty Gibbs: 249.5
…
25. Noah Gragson: 52.75
26. Michael McDowell: 39.75
27. Shane Van Gisbergen: 36
28. Alex Bowman: 32
29. Connor Zilisch: 11
30. Ricky Stenhouse: 8.5
Best AVERAGE FINISH last four races at Darlington
1. Tyler Reddick: 4.25
2. Denny Hamlin: 6.5
3. Chris Buescher: 7.75
4. Ross Chastain: 9.75
5. Austin Cindric: 10.25
6. Chase Briscoe: 10.5
…
25. Kyle Larson: 23
26. Shane Van Gisbergen: 23
27. Ricky Stenhouse: 26.5
28. Michael McDowell: 27.5
29. Alex Bowman: 28.33
30. Josh Berry: 30.5
With those stats in mind, my top-rated drivers at Darlington (and track designation), in order, are Reddick, Larson, Byron, Buescher, Briscoe. In terms of recent ratings, the top 5 are Blaney, Briscoe, Larson, Gibbs, Bell. All of it goes into the making of my initial simulation, which can be seen now on the NASCAR HUB at VSiN.com.
The final simulation will be made available Saturday afternoon after practice and qualifying, which is set for 4:30 p.m. ET. Remember, QUALIFYING and starting spot have been crucial lately. That said, having to make my predictions at this point (which could change a bit after P&Q), I would go with the following:
Top 5: Reddick, Briscoe, Byron, Hamlin, Blaney
Top underdogs to consider (+1400 or more): Gibbs, Buescher, Keselowski, Hocevar
Favorites to struggle: Bell, Elliott, Logano, SVG
The 367-lap event at Darlington is set for 5 p.m. Sunday, a Labor Day weekend tradition.
Be sure to visit VSiN.com for this week’s full INITIAL SIMULATION. This is where you’ll find the sims all season long. While there, you can click on driver links for season stats and recent results, plus get current odds, and much, much more.