


YellaWood 500 Predictions: Top 5 Picks and Best Long Shots:
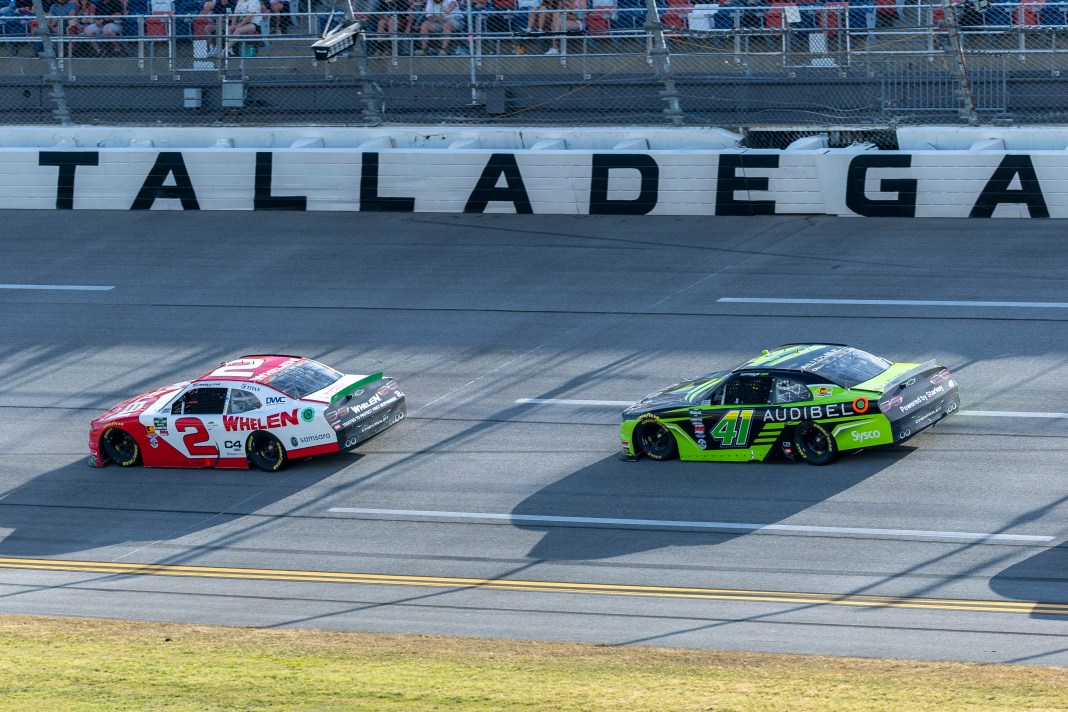
If you ask any of the drivers in the running for the 2026 NASCAR Cup Series title, they would point to one weekend where the race could change everything, and undoubtedly, this is it, as the series heads to dangerous Talladega Superspeedway for the running of the YellaWood 500.
According to my handicap-ability ratings, Talladega receives a grade of F+, edging only Daytona. Races here are about as big of a crapshoot as you’ll get on the circuit. However, this does mean underdogs can score well for bettors, and in fact, Chase Briscoe took home the checkered flag at +1800 last year. He is an expected contender this week as well, as my initial simulation projects him as the winner, differing slightly from the odds at DraftKings, which lists him tied for third best at +1400.
Besides Briscoe, on our initial simulation,
Bubba Wallace is projected second this week in our initial simulation, just ahead of Joey Logano, Ryan Preece and Christopher Bell. It isn’t until No. 8 that the DK favorite Ryan Blaney pops up. However, you’ll see later in the stat leaders section that Blaney has struggled recently at Talladega after being the series’ most dominant driver at this venue for most of the past decade. Of course, knowing the racing style and the recent history at Talladega, it would be miraculous for any of the six guys I’ve mentioned to finish near their projected spots. With that in mind, if they can avoid trouble, the prices for them and other top superspeedway drivers are way more attractive than usual. Of course, avoiding the “big one” for 188 laps at NASCAR’s biggest and fastest track takes special skill and a whole lot of luck.
If you’re wondering what makes me give a track like Talladega a handicap-ability grade of F+, it’s because almost anything can and will happen there. Tracks like this, and Daytona, are known for drafting, and with both tracks in excess of 2.5 miles around, the speeds can get pretty high, too. Thus, the cars are packed together at insane speeds. Often, the results of this are called “big ones” or accidents that can wipe out up to a dozen cars at a time. Additionally, if the cars don’t crash, there’s a good chance that a driver can drop 10-15 positions in a single lap by making an ill-timed move that leaves him without drafting help. This makes these races altogether unpredictable using statistical techniques. That said, we generally do know the drivers who tend to run up front most in these races, and they are typically those who line up at the top of the simulations. You can also get them at prices that are better than most other venues. Consider guys like Wallace, Ryan Preece and Todd Gilliland as drivers who don’t get a lot of attention at other tracks but deserve some here.
Getting back to this being the wild-card race of the 2026 Chase, seven drivers are legitimately still in the hunt for the 2026 season title. Obviously, with just two races left after this one, avoiding a horrible points day via a crash might be the ultimate goal for those guys. After a bad finish at Phoenix, Kyle Larson holds a five-point lead over Bell. Briscoe is 24 back, Denny Hamlin is 31 out, with Penske teammates Blaney (-40) and Logano (-44) next, followed by last week’s top underdog, Phoenix winner Tyler Reddick, the last remaining contender, 56 points behind. A win by any of those drivers at Talladega could be a championship-level moment, especially with the potential for other drivers to be far less fortunate on Sunday. One of the most interesting storylines for Sunday’s race will be how Hamlin approaches the racing strategy. He is well known for lying back to avoid wrecks in these races while figuring he can make moves late to secure better finishes. However, with his championship odds slipping a lot in recent weeks, he has now gotten himself into a desperate position and may choose to “go for it” this week. I would definitely count him as a live underdog should he adopt that strategy, as he has been known as a tremendous drafting driver in his career.
Before digging into what to look for statistically at Talladega, here’s a quick wrap-up of what happened last week at Phoenix, with Tyler Reddick winning at +1300 as a top underdog, and how our simulation projections have fared in terms of betting results to date through 33 races.
Initial Phoenix simulation winner: Loser (-1 unit) – NOW -5.15 units for the season
Final Phoenix Simulation winner: Loser (-1 unit) – NOW +27.05 units for the season (These are +83.85 units for the last two seasons!)
Final Phoenix Simulation Top 2 drivers To Win: Two losers – total return -2 units – NOW +4.35 units for the season
Final Phoenix Simulation Top 3 drivers To Win: Three Losers – total return -3 units – NOW +0.65 units for the season (Reddick won from the 9th projected position)
Final simulation Top 3 Phoenix projections: one winner, two losers –total return -1 units – NOW -2.1 units for the season
Final simulation Top 5 Phoenix projections: two winners, three losers – total return -1.9 units – Now -40.75 units for the season
We hit on five top-10s, and if you go by my NASCAR wagering standard of never laying more than -250 on any bet, that would have been two out of five available options. Next season, I will track my results using the new -250 threshold strategy for the full season.
Now for my final personal picks, which are published each race day in the VSiN Email Newsletter …
Final simulation Top 3 Phoenix projections: one winner, two losers – total return -1 unit – Now -54.8 units for the season
Top Phoenix Long shots to win: one winner, three losers – total return +10 units – Now -9 units for the season
Favorites to struggle at Phoenix: Gibbs (10th), Chastain (9th), Elliott (3rd), Bowman (29th) – Now 93 for 133 for the season picking usual contending drivers to finish outside of the top 10.
Now let’s look ahead to Talladega on Sunday, using the stats from the four races that have been run at this 2.66-mile superspeedway over the last two years. Typically, these tracks are all about drafting skill and avoiding crashes. Of the simulation factors, they are all relatively even. There is no practice for this race and qualifying on Saturday is of only minimal significance. That said, with what is currently a 10-car logjam at the top with drivers showing average ratings between 80.1-87.7, I wouldn’t be surprised to see someone other than Briscoe wind up on top of the final projections. Here are the stats for the last four races at Talladega for all active drivers that have raced here, with four different winners in that span. In fact, the last 12 races here have produced 12 different winners:
Average STARTING POSITION last four races at Talladega
1. Austin Cindric: 6.5
2. Michael McDowell: 9
3. Ryan Blaney: 9.25
4. Ryan Preece: 9.5
5. Denny Hamlin: 10.25
6. Chris Buescher: 12.5
…
27. Erik Jones: 27.5
28. Ty Dillon: 28.33
29. Noah Gragson: 28.5
30. Shane Van Gisbergen: 29.25
31. John Hunter Nemechek: 29.5
32. Ricky Stenhouse: 31.5
Average RUNNING POSITION last four races at Talladega
1. Joey Logano: 12.5
2. Ryan Preece: 14.25
3. Todd Gilliland: 15.75
4. Chris Buescher: 16.25
5. Alex Bowman: 16.5
6. William Byron: 16.75
…
27. Cole Custer: 22
28. Ryan Blaney: 22.25
29. John Hunter Nemechek: 22.5
30. Erik Jones: 23.5
31. Daniel Suarez: 24.25
32. AJ Allmendinger: 26.75
Average DRIVER RATING last four races at Talladega
1. Joey Logano: 96.58
2. Ryan Preece: 88.25
3. Darrell Wallace: 87.05
4. Chris Buescher: 84.78
5. Chase Briscoe: 82.68
6. Ross Chastain: 81.1
…
27. Chase Elliott: 64.6
28. Daniel Suarez: 64.48
29. Ty Dillon: 60.8
30. Erik Jones: 59.18
31. John Hunter Nemechek: 57.25
32. AJ Allmendinger: 45.33
Most AVG LAPS RUN in TOP 15 last four races at Talladega
1. Joey Logano: 132.25
2. Ryan Preece: 118.75
3. Todd Gilliland: 108.5
4. Chris Buescher: 107.75
5. Darrell Wallace: 94.5
6. Alex Bowman: 92.5
…
27. Ty Dillon: 59
28. Carson Hocevar: 58.75
29. John Hunter Nemechek: 52.75
30. Erik Jones: 50
31. Daniel Suarez: 43.5
32. AJ Allmendinger: 34.25
Best AVERAGE FINISH last four races at Talladega
1. Carson Hocevar: 7.25
2. Todd Gilliland: 13.5
3. Zane Smith: 14
4. Alex Bowman: 14.25
5. Tyler Reddick: 14.25
6. Darrell Wallace: 14.75
…
27. Joey Logano: 23.25
28. Michael McDowell: 24.75
29. John Hunter Nemechek: 24.75
30. AJ Allmendinger: 26.75
31. Josh Berry: 32.5
32. Ryan Blaney: 34.5
Most % AVERAGE LAPS FINISHED last four races at Talladega
1. Carson Hocevar: 100%
2. Zane Smith: 100%
3. Tyler Reddick: 100%
4. Denny Hamlin: 100%
5. Ty Dillon: 100%
6. Todd Gilliland: 99.9%
7. Daniel Suarez: 99.9%
8. Shane Van Gisbergen: 99.9%
…
27. Noah Gragson: 81.5%
28. AJ Allmendinger: 81.3%
29. Chase Elliott: 81.0%
30. Chris Buescher: 80.9%
31. Brad Keselowski: 77.7%
32. Ryan Blaney: 61.6%
There are obviously some very unusual names on the top and bottom lists for these stat categories. With those stats in mind, my top-rated drivers at Talladega, in order, are Preece, Wallace, Logano, Buescher, Cindric. In terms of Track Designation ratings, the top guys are Chastain, Buescher, Wallace, Preece, Logano. And finally, for recent ratings, the top 5 are Briscoe, Blaney, Larson, Bell, Logano. All of it goes into the making of my initial simulation, which can be seen now on the NASCAR HUB at VSiN.com.
The final simulation will be made available Saturday afternoon after qualifying, which is set for 1 p.m. ET. There are no practice sessions at Talladega. That said, having to make my predictions at this point (which could change a bit on Sunday in the morning VSiN Newsletter), I would go with the following:
Top 5: Logano, Hamlin. Preece, Briscoe, Blaney
Top underdogs to consider (+1400 or higher): Briscoe, Keselowski, Cindric, Hocevar, Wallace, Hamlin
Favorites to struggle: Elliott, Gibbs, Reddick, Larson
The 188-lap event at Talladega is set for 2 p.m. ET on Sunday.
Be sure to visit VSiN.com for this week’s full INITIAL SIMULATION. This is where you’ll find the sims all season long. While there, you can click on driver links for season stats and recent results, plus get current odds and much, much more.
SPONSORED
8 STRAIGHT WINNERS. +$3,200.
The Doc’s Sports AI is absolutely hammering the books — and these games HAVEN’T EVEN BEEN CLOSE.
During this 8-game winning streak, the average cover margin is a ridiculous 13.75 points – See Here
And this isn’t some one-week heater.
Since launching less than a year ago, Doc’s Sports AI has generated more than +$22,500 in profit for $100-per-unit bettors.
Now Doc’s Sports AI-v3 is unleashed for football season — and it’s already delivering.
8 STRAIGHT. +$3,200. +$22,500 SINCE LAUNCH.
The numbers are doing the talking. Today you can use promo code VSIN90AI and get 90% off a 3 day package of Doc’s Sports AI-v3