

Full Super Bowl Betting Trends and Systems:
Last week in the VSiN Super Bowl 59 Betting Guide, I released a piece detailing my top nine historical trends regarding the big game. Well, it seems like that wasn’t enough as I have received several inquiries wondering if I would again put out the full Super Bowl trends piece readers have become accustomed to. Well, the answer is yes, as I use it to prepare my wagers for Super Bowl Sunday, so of course I’m going to share it. So, as you get ready for Chiefs-Eagles, enjoy this buffet of stats, trends and other key handicapping information.
These teams met in the Super Bowl just two years ago, but there are plenty of things in that will make it a completely different game this time. The Chiefs are looking to become the first NFL team to win three consecutive Super Bowls. They got here by winning 15 games in the regular season and two in the playoffs. However, after 17 games, they are only outscoring opponents by 3.8 PPG after winning 13 times by single digits. Of course, they are still led by quarterback Patrick Mahomes, who had a down year statistically by his standards but continues to win games. Philadelphia got back to this stage by changing its offensive philosophy, relying greatly on the run game after signing free-agent running back Saquon Barkley. He enjoyed an MVP-caliber season and has only upped his level of play in the playoffs. The Eagles were even better on the other side of the ball this year, allowing the fewest PPG in the NFC, just 17.8.
Despite Philadelphia’s statistical superiority in this matchup, oddsmakers have shown enough belief in the championship pedigree of the Chiefs to install them as 1.5-point favorites. The total opened at 49.5 but has since dropped to 48.5. Two years ago, Philly closed as a 1.5-point favorite with a total of 51.5. The final of that game was Chiefs 38, Eagles 35.
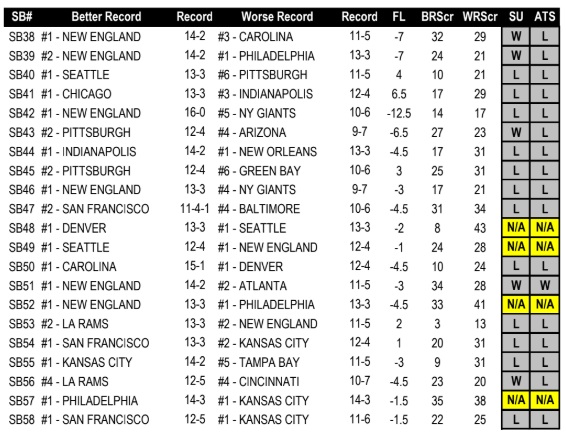
We have a sample size of 58 Super Bowls in which to find definitive trends and patterns. That’s what I’ve laid out for you here.
Super Bowl Stat Angles
Over the two-week break, these teams will get to know the other’s tendencies inside and out as their coaching staffs pour over film and prepare a game plan so thoroughly that nothing will surprise them. Of course, extensive planning doesn’t always dictate how the game will go.
The game most often comes down to preparation and execution. This execution can be measured by statistics. Rushing yards, passing yards per attempt, turnovers and time of possession are four key statistical categories that I have found to have a great impact on who has won Super Bowls. The following trends demonstrate the importance of these statistics.
* Teams that rush for more yards in the Super Bowl are 43-15 SU and 41-14-3 ATS (74.5%). The Chiefs outrushed the 49ers last February, 130-110.
* Teams that average more passing yards per attempt in the NFL title game are 44-14 SU and 37-18-3 ATS (67.3%). This one actually lost last year as the 49ers and QB Brock Purdy outgained Mahomes and the Chiefs in this category 6.8-6.6.
* In the 45 previous Super Bowls in which there was a turnover advantage for either team, the team that had fewer turnovers has lost just eight times, going 35-9-1 ATS (79.5%). Last year’s turnover battle was even, 2-2.
* Teams that win the time of possession battle are 41-17 SU and 39-16-3 ATS (70.9%) in the history of the Super Bowl, but the 49ers were the latest to lose on that edge, holding the ball for about two minutes longer than Kansas City.
* Teams that hold an edge in at least three of the four key statistical categories above are 40-6 SU and 36-9-1 ATS (80%). Amazingly, four of those outright losses were in the last 10 games, including 2023.
* Teams that win all four categories are 26-0 SU and 24-1-1 ATS (96%). The only ATS loss occurred in Super Bowl XXXIX in Philadelphia’s ATS win versus the Patriots.
The Buccaneers were the last team to sweep the four categories in Super Bowl 55 and won handily. In last year’s game, the 49ers claimed 2 1/2 of the four categories but lost, demonstrating how the Chiefs’ win turned out to be somewhat of an anomaly.
For those of you looking to project this type of information for 2025, turnovers can be hard to project, although the amount of pressure each team’s defense puts on an opposing quarterback can prove to be a good indicator. For the record, the Eagles’ offense was superior in the regular season to Kansas City’s in the yardage/TOP categories while the Chiefs had one fewer turnover.
In-Game Scoring Trends
* In terms of scoring, the average winning score is 30.0 PPG, with the average losing score being 16.5 PPG, an average winning margin of 13.5 PPG. However, 19 of the last 21 games have been decided by 14 points or fewer, signaling a much more competitive era in the NFL. One of those two blowouts was, of course, in 2021. This year’s game and its tight point spread again point to a competitive game.
* The Giants of 2008 were the first team in 33 years to win the Super Bowl without hitting the 20-point mark. The Patriots did it again in 2019 with the lowest winning point total ever, 13 points.
* Since the epic 35-31 duel between Pittsburgh and Dallas in Super Bowl XIII in 1979, 28 teams have hit the 30-point mark in this game, their record: 25-3 SU and 24-4 ATS. Of course, in 2023, Philadelphia put up 35 points, the most ever for a losing team.
* Twenty-two Super Bowl teams have failed to reach the 14-point mark. Their record … 1-21 SU and ATS (4.5%). This is another trend illustrating just how improbable the Patriots’ 2019 win was.
* More on the recent competitiveness of the game, of the only 19 games to be decided by less than a touchdown, 10 of them have come in the last 17 years.
Past Super Bowl Line and Total Patterns
Since the turn of the century, what it takes to reach Super Bowl success has come and gone in waves. In the first few years of the 2000s, it was top seeds or teams that achieved lofty won-lost marks in the regular season fulfilling expectations.
From 2006-2013, that changed, as seven teams that played on wild-card weekend played in the Super Bowl, and six of them won. The 2006 Super Bowl run by Pittsburgh was significant as I believe it dramatically changed the belief of teams in what it takes to become a champion in the NFL. The Steelers were the first No. 6 seed that emerged to win the Lombardi Trophy. The assumptions that winning in the regular season, earning a bye week and capitalizing on home-field advantage were the recipe to postseason success were now in doubt.
Then, the seven-year span of the Super Bowl from 2014-20 seemed to bring about a return to “normalcy” with all but two competing teams having won at home in their conference title games after enjoying byes in the wild-card games. However, underdogs did win outright in four of those seven games, presenting another wrinkle to deal with.
The 2021 and 2022 games threw us for a new loop, with a fifth-seeded Tampa Bay team winning in upset fashion, and the Rams winning a matchup between two No. 4 seeds but not covering the Vegas number. That peculiar seed matchup marked the first Super Bowl in the modern seeding era where neither a No. 1 nor a No. 2 seed was in the game.
Of course, it was a short-lived trend in that the 2023 matchup pitted No. 1 seeds against one another. Last year we had a 1 and a 3, the first such game since Super Bowl 41 in 2007 when No. 3 Indianapolis took down No. 1 Chicago 29-17. Kansas City equaled that feat as a No. 3, taking down No. 1 San Francisco 25-22. However, despite all of the recent seed craziness, one thing is for sure lately, and you’ll see more details in a bit, we are in the throes of an underdog-dominated Super Bowl era.
All of this has naturally made it difficult on handicappers who rely on such things as strength ratings and historical templates that have demonstrated the best teams excelling when it mattered most, the title game.
Nearly a decade ago, I finally convinced myself about the motivational edge of being the lower-seeded team in these games, and it has performed remarkably since. Perhaps there’s something else you’ll like even better as we dig into ATS, money line and total trends.
As you read this, I must remind you that this year’s playoffs have been a bit more predictable than recent years, with home teams winning 10 of 12 games.
ATS and Money Line Trends
* Favorites in the Super Bowl are 35-22 SU but own an ATS mark of 25-29-3 (46.3%). However, over the past 23 years, underdogs own a 17-6 ATS (73.9%) edge, including 13-4 ATS in the last 17. Kansas City has pulled off outright upsets in each of the last two Super Bowls as exactly 1.5-point underdogs. For this season, early line action finds Kansas City as a small 1.5-point favorite over Philadelphia.
* Favorites of a touchdown or more are 3-2 SU but 0-4-1 ATS (0%) since the millennium. Still, there hasn’t been a favorite of that magnitude since the Patriots in 2008.
* The outright winner is 48-7-3 ATS (87.3%) in the 58 previous Super Bowls. This is the highest mark of any playoff round. Interestingly, one of those ATS losses did occur as recently as 2022 when Cincinnati became the first underdog to cover a point spread without winning on a Super Bowl line of less than six points. The general thought is that champions typically leave little doubt in this game. Consider this if you have any concern about laying points with Kansas City, or alternatively, taking a money line wager with the underdog Eagles.
* The AFC and NFC are now split all time at 29 outright wins apiece. The NFC maintains a 28-27-3 (50.9%) ATS edge, the slightest of margins. However, AFC teams are 8-3 ATS in the last 11.
* The team that is the better playoff seed is just 2-16-2 ATS (11.1%) in the last 27 Super Bowl games! Note, in 2011, 2014, 2015, 2016, 2018, 2019, 2022 and 2023, equal seeds matched up. The 2025 finds No. 1 Kansas City taking on No. 2 Philadelphia.
* The team with the better record going into the Super Bowl game is 30-20 SU all time but has lost 12 of the last 14 and is on a 1-16 ATS skid since 2004, including the 49ers (12-5) SU/ATS loss to the Chiefs (11-6) in 2024. New England’s epic comeback against Atlanta in the 2017 game was the only ATS win. This premier trend will once again be in play as Kansas City was 15-2 in the regular season and Philadelphia 14-3.
* Teams looking for their first Super Bowl win against a prior champion are 6-8 but 11-2-1 ATS in their last 14 chances. Each year, this trend is becoming more and more scarce, but 12 current franchises have never won the big one. We were very close to seeing it happen with the Bills, but their 32-29 loss at Kansas City in the AFC title game ended that chance. If you’re wondering, Philadelphia is 1-3 SU and 2-2 ATS in four prior Super Bowl appearances, with its only title coming in the 2018 game. Kansas City is 4-2 SU and ATS in its prior six appearances in this game and is looking to become the first team ever to three-peat.
* In the last five matchups between No. 1 and 2 seeds, the 2 seeds own a 4-1 SU and 3-2 ATS edge.
Over/Under Trends
* Overall, in the 55 Super Bowl games that have had totals, the results are perfectly split 28 Overs, 28 Unders, 1 push. Under is on a current surge of 5-1 in the last six. The 2024 game went Under by just a half-point, with 34 of the game’s 47 points scored after halftime.
* There have been 46.5 PPG scored in the Super Bowl, on posted totals averaging 45.0. However, the early years’ totals were often in the 30s, dragging that number down significantly. The last 20 years have seen an average posted total of 49.9, with 47.7 PPG scored. Twelve of the 20 games in that era went Under.
* Of note, in the 12 past Super Bowls with totals in the 50s, Under is 9-4 (69.2%). Of course, this lost mightily in 2023 as the Eagles-Chiefs game flew over the total by 21.5 points. Totals in the 40s are on a 7-2 UNDER (77.8%) run. With the total sitting at 48.5, this will be in play.
* The 2024 Super Bowl was one of only 20 in history that saw both teams reach the 20-point mark. Fifteen of those were Overs. Oddsmakers expect both teams to score in the 20s here (25-23.5), as evidenced by the line/total combination.
6-point Teaser Trends
* Looking back at the 58 Super Bowls in terms of 6-point teaser trends, favorites are 38-19 (66.7%) while underdogs are 39-17-1 (69.6%), relatively close performance marks. However, in the last 23 seasons, there has been a big separation as favorites are just 13-10 (56.5%) while underdogs are 20-3 (87%). An underdog 6-point teaser would put Philadelphia at +7.5, likely a very attractive wager for most bettors considering how few games the Chiefs have won convincingly this season.
* In terms of the two conferences, AFC teams are 38-19-1 (66.7%) and NFC teams are 41-17 (70.7%) in the history of the Super Bowl game on 6-point teaser bets.
* Concerning Super Bowl totals, in the 57 games that had posted numbers, Over is 39-18 (68.4%) and Under is 38-18-1 (67.9%) on 6-point teasers. For the 2024 game, both Over and Under teaser bettors won handily.
Regular-Season Offensive Statistics Trends
· Teams that scored more points per game during the regular season are only 7-14-1 ATS (33.3%) in the last 22 Super Bowls. Philadelphia was No. 7 in the NFL in scoring this year at 27.2 PPG, while Kansas City was No. 15, 4.6 PPG worse.
· The ability to run the football has been much overrated when it comes to Super Bowl success. Teams that averaged more rushing yards per game are just 5-15 ATS (25%) since 2005. Those that averaged more yards per rush are 7-13 ATS (35%) in that span. Philadelphia owns significant edges in both categories.
· Overall passing yardage has also meant little in terms of Super Bowl success, with teams owning an edge in total offensive passing yardage going only 9-14 ATS (39.1%) in the last 23 games. Kansas City holds a 34+ YPG edge in overall passing yardage.
· Big-play potential hasn’t proven to be a key ingredient to Super Bowl victories either, as teams gaining more passing yards per attempt are on a 7-11 ATS (38.9%) stumble. The Eagles were the No. 7-ranked team in the NFL in passing efficiency in the regular season while K.C. was No. 23.
· Teams that generated more yardage overall offensively in the regular season also own no edge when it comes to Super Bowl success, going 2-11 SU and 1-12 ATS (7.7%) in the last 13. Those with yards-per-play edges are 3-10 SU and 2-11 ATS (15.4%) in that same span. Philadelphia holds these “edges” in 2025.
· Offensive yards per point has proved to be an effective statistical indicator for fading teams, as teams that have averaged fewer yards per point are just 7-15 ATS (31.8%) in the last 22 Super Bowls. Philadelphia again holds an edge here, 13.5 to 14.5.
· The offensive turnovers statistic has also been quite misleading in terms of Super Bowl handicapping, with teams owning an edge in this stat going just 7-14 ATS (33.3%) in the Super Bowl since 2003. The Chiefs tied for fourth in the NFL in offensive turnovers, while the Eagles were sixth.
· Teams that converted third-down opportunities more efficiently in the regular season also have a poor trend mark, 8-15 ATS (34.8%) in the last 23 Super Bowls. These two teams both ranked in the top 10 of the NFL in this category in the regular season, with the Chiefs owning the edge.
It appears to be detrimental to have generated the better offensive statistics in the regular season, coinciding directly with the recent success of underdogs and teams with the lesser records in this game.
Regular-Season Defensive Statistics Trends
· Teams that allowed fewer points per game during the regular season have gone 8-1 SU and 7-2 ATS (77.8%) in the last nine Super Bowl games, including Kansas City a year ago. Philadelphia holds this slight edge by 1.4 PPG.
· Teams that allowed fewer rushing yards per game have gone 6-3 SU and 7-2 ATS (77.8%) in the Super Bowl games of the last nine seasons. Those that allow fewer yards per rush attempt are 7-2 SU and 6-3 ATS (66.7%) in that same span. Kansas City owns the better rushing defense, both in overall yardage and yards per attempt.
· Super Bowl teams with an edge in defensive passing yardage allowed over their opponent are 11-11 ATS over the last 22 seasons but just 1-5 ATS in the last six. Teams with the edge in defensive pass efficiency are 8-5 ATS (61.5%) over the last 13 years. The Eagles own significant edges in both categories, ranking No. 1 in the league in both.
· Teams that allowed less yardage overall defensively are also just 7-11 ATS (38.9%) since 2007 but 7-6 ATS (53.8%) since 2012 in the Super Bowl. Teams with an edge in yards per play are 8-10 ATS (41.2%) since 2007 but 8-5 ATS (61.5%) in the last 13. Chalk both of these edges up to the Eagles, the league’s best team in these regards.
· Defensive yards per point should only be given serious consideration for Super Bowl Sunday if you are fading the team with the edge, 7-12 ATS (36.8%) since 2006. Give Kansas City the edge here, 16.7 to 15.6.
· Teams that forced more turnovers in the regular season than their opponent are 10-13 ATS (43.5%) since 2002 in Super Bowl play. Philadelphia forced more turnovers in the regular season than the Chiefs, by 0.3 per game.
· Teams that stopped third-down opportunities more efficiently in the regular season are on a 9-6 ATS (60%) run in the last 15 Super Bowls. Philadelphia was third in the NFL, Kansas City just 26th.
There has been increasing evidence that better defensive teams have the advantage in recent Super Bowls, certainly when compared with the effectiveness of offensive statistical edges.
One final thing, for those of you who like to follow the line moves closely, hoping that sharp money may be the cause, consider that bettors are just 8-9 ATS (47.1%) in the last 17 Super Bowl games in which they moved an opening line but 12-6 (66.7%) in the last 18 games in which they moved totals. This includes a streak of seven straight winners on total moves. For what it’s worth, the early action since the line/total opened seems to be steady on the point spread with a 1-point move downward on the total.
Top Team Trends from the VSiN.com Matchup Report
Favoring Kansas City:
– Kansas City 10-4-1 ATS in its last 15 games against elite rushing teams averaging more than 4.7 RYPA.
– Kansas City is on a 48-33-3 ATS run against solid passing defenses yielding less than 5.95 PYPA.
Favoring Philadelphia:
– Philadelphia is on an 8-2 ATS run versus good teams with 70% or better winning pct.
– Philadelphia is on a 32-18 ATS surge versus solid defensive teams allowing less than 20 PPG
Favoring OVER the total:
– Kansas City is on a 38-18-2 Over the total surge against shutdown passing defenses yielding less than 5.75 PYPA
– Philadelphia is 11-4 Over the total in its last 15 games versus AFC West foes
Favoring UNDER the total:
– Kansas City is on a 13-1-1 Under the total surge against elite rushing teams averaging more than 4.7 RYPA
– Philadelphia is 21-12-1 Under the total in its last 34 playoff games
We will have even more trends and systems for you to utilize in our final VSiN NFL Analytics Report for the 2024-25 season, due out on Wednesday.
For more Super Bowl analysis, visit the Super Bowl Betting Hub, exclusively on VSiN.


