
Hello,
Welcome to the VSiN NBA betting headquarters. With the 2026-27 regular season tipping off October 20, the intensity on the hardwood is back in full swing. Whether you're hunting for NBA picks for today's games to pad your bankroll, looking for deep-value NBA predictions ahead of the 2027 NBA Playoffs, or looking to stay ahead of the curve during the Emirates NBA Cup group stage, our experts provide the analytical edge you need. From opening night through the crowning of a new champion next June, VSiN is your home for sharp basketball insights.
July 11, 2026
The 2026 NBA Summer League is in full swing in Las Vegas, Nevada. Well, as the Vegas Sports & Information Network, it’s only fitting that...
July 11, 2026
The 2026 NBA Summer League is in full swing in Las Vegas, Nevada. Well, as the Vegas Sports & Information Network, it’s only fitting that...
July 9, 2026
The 2026 NBA Summer League is in full swing in Las Vegas, Nevada. Well, as the Vegas Sports & Information Network, it’s only fitting that...
July 8, 2026
The 2026 NBA Summer League begins right near VSiN’s headquarters on Thursday, July 9, as all 30 teams will be represented in Las Vegas, Nevada....
June 30, 2026
On Tuesday, June 30, NBA teams were allowed to start negotiating and reaching contract agreements with new free agents. Of course, some of these conversations...

June 26, 2026
With the 2025-26 NBA Playoffs ending with yet another disappointing exit, the Minnesota Timberwolves have been looking to make a splash, and on Thursday, June...
June 24, 2026
The 2026 NBA Draft is in the books, and as always, there were moves that made sense, moves that raised eyebrows, and a few picks...
June 22, 2026
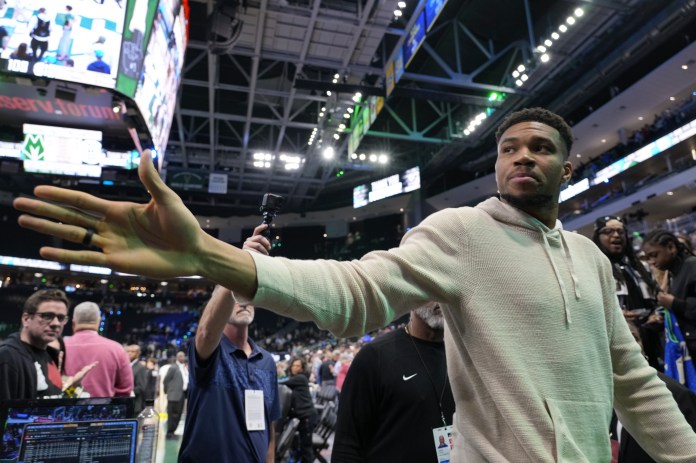
🏀 Blockbuster Trade Just in Time for Draft Day The biggest domino of the NBA offseason fell late Monday night. The Heat acquired Giannis Antetokounmpo...
June 22, 2026
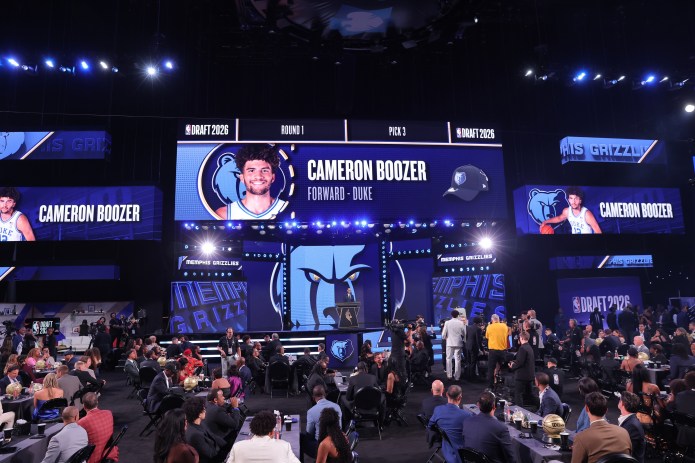
2026 NBA Draft Predictions and Best Bets The 2026 NBA Draft will begin on Tuesday, June 23, when we’ll see the first 30 players come...
June 21, 2026
The 2026 NBA Draft is just around the corner. That gives us an event to dive into — and bet on — before some of us...

June 21, 2026
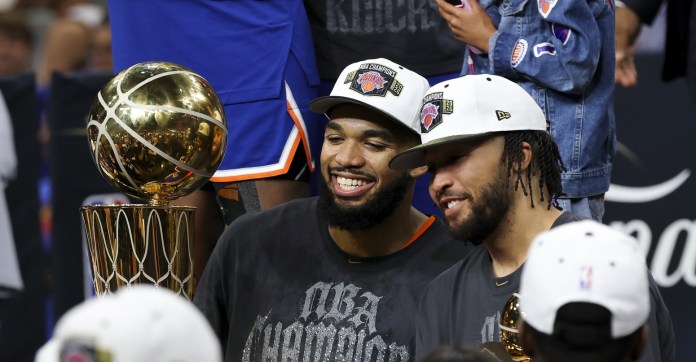
The 2025-26 NBA season is officially over. The New York Knicks defeated the San Antonio Spurs in an exciting five-game series, and the fresh blood...
June 13, 2026
This will go down as the most dramatic NBA Finals . . . that only lasted five games. Thanks to a remarkable postseason run, the...
Our daily NBA picks are designed to cut through the noise by focusing on load management updates, shooting regressions and officiating tendencies. Every morning, we refresh our NBA picks today to ensure you have the most accurate information before the lines move.
Early in the season, our NBA best bets prioritize teams working through rotation battles, new coaching schemes and roster continuity following the offseason. We don’t just provide a spread; we analyze the “clutch” metrics that determine winners in the final two minutes. If you’re looking for NBA picks for today, look no further than our daily breakdown of totals, player props and moneyline value.
Success in betting professional basketball requires a blend of traditional scouting and advanced analytics. As the league heads into the fourth edition of the in-season Emirates NBA Cup (group play runs Oct. 30-Nov. 27, with knockout rounds and a Dec. 11 championship in Indianapolis), our NBA predictions shift to short-term value and roster health checks. We analyze how star players perform as workloads ramp up early in the year. Check back daily for NBA predictions that go beyond the box score to give you a true professional’s perspective on every matchup.
The road to the Larry O’Brien Trophy is officially open again. Our futures hub tracks the 2027 NBA Championship odds in real time, identifying which contenders are building momentum through the regular season and the Feb. 21 All-Star Game in Phoenix. With the 2027 NBA Playoffs set to begin in mid-April and the NBA Finals to follow in June, identifying early value in the Eastern and Western Conference markets is essential.
We provide specialized coverage of the NBA Playoff Bracket as it takes shape, offering NBA predictions on potential sleepers and early-season surprises. Whether you are betting on a repeat champion or a first-time winner, our analysis of roster depth and coaching adjustments will guide your NBA bets through every round of the 2026-27 season.
Betting on the NBA is a different beast in every phase of the season, from the early-schedule feeling-out process to the playoff push. Rotations shorten and defensive intensity rises as the year goes on. Stay tuned to VSiN for exclusive betting splits and future trends that will keep you ahead of the curve all the way from opening night through the NBA Finals.
Before the 2026-27 season kicks off in October, the NBA’s newest talent gets its first real test in NBA Summer League. The California Classic in San Francisco and Sacramento (July 3-6) and the Salt Lake City Summer League (July 5, 7-8) opened the circuit, with the marquee event, the Las Vegas Summer League, running July 9-19. This is where the 2026 draft class, headlined by the top picks from the June 23-24 Barclays Center draft, gets its first extended run against other rookies and young roster hopefuls, alongside second-year players looking to build on their rookie campaigns.
Our NBA Summer League predictions today focus on the matchups that matter most for player development and roster battles, from rookie scoring pace to how young bigs hold up defensively against NBA-level speed. NBA Summer League odds tend to be thinner and move more on limited minutes and load management than regular-season lines, so our NBA Summer League betting coverage leans on rotation notes, coaching tendencies and which prospects are already outplaying their draft slot rather than pure numbers. If you’re looking for NBA Summer League bets before the circuit wraps, our NBA Summer League predictions give you an early read heading into training camp in late September, when the games start to count for real.
Get quick answers to the most common questions about betting on the NBA, from the 2026-27 season schedule to how Summer League odds work.
The 2026-27 NBA regular season is set to open on October 20, 2026, following preseason games including the NBA China Games on October 9 and 11.
NBA Summer League runs in July before the new season, with the California Classic (July 3-6), Salt Lake City Summer League (July 5, 7-8), and the marquee Las Vegas Summer League (July 9-19) making up the circuit.
Yes, sportsbooks post NBA Summer League odds, though markets are typically thinner than regular-season lines since teams rotate rosters heavily and limit playing time for top prospects.
The Emirates NBA Cup is the NBA’s in-season tournament. Group play runs October 30 through November 27, with knockout rounds following and the championship game on December 11 in Indianapolis.
The All-Star Game is scheduled for February 21, 2027, in Phoenix, Arizona, capping All-Star Weekend.
The playoffs are expected to begin in mid-April 2027 following the play-in tournament, with the NBA Finals concluding the season in June.
Summer League betting relies more on roster battles, coaching tendencies, and player development than the deeper analytics used during the regular season, since limited minutes and unfamiliar lineups make traditional models less reliable.
VSiN updates NBA picks daily throughout the season, covering spreads, totals, player props, and moneyline value based on matchup analysis and betting trends.