Money Moves producer Justin Emery shares his handicapping process and the excellent results he has had betting on the Daily MLB Strikeout Leader prop market.
For about five seasons, my MLB betting had focused almost exclusively on pitcher strikeout props.
Then I hit a frustrating two-week stretch in May.
I decided to take a few days off, and sometime during that break I stumbled across a market on the Caesars app I had never really paid attention to before: Daily Strikeout Leader.
The odds immediately got my attention.
I had spent years handicapping whether a pitcher would go Over or Under 5.5 or 6.5 strikeouts, often at a price somewhere around even money. Now I was staring at some of those same pitchers at +600, +1000, +1500, +2000 and sometimes much longer to lead the entire slate.
On my second day betting it, I had Kyle Harrison at +600.
He struck out 12 and won.
The very next day, I hit Chase Burns at +700.
I knew I wasn’t going back.
What I didn’t realize yet was that the way I had been handicapping pitcher strikeouts for the previous five years may have actually been better suited for this market than the traditional K props I had been betting.
I Had Already Been Preparing for This Market
My handicapping process didn’t need to be completely rebuilt.
I was already using analytics along with tools like OptaAI and Ballpark Pal on VSiN. I was digging into pitchers every day.
What changed was the question I was trying to answer.
For a traditional strikeout prop, you’re trying to decide whether a pitcher can clear a number set by the sportsbook.
For Strikeout Leader, I needed to figure out something different:
Who on today’s slate is actually capable of putting up the type of strikeout performance that can beat everybody?
I started creating my own daily list of pitchers who I believed had a legitimate chance to lead the slate.
With the small circle of people I trusted enough to talk about the market with, I had a much simpler way of describing it:
FINDING DUDES
That’s what I was trying to do every day.
To find them, I dug into K%, total strikeouts, whiff percentage, swing-and-miss numbers both inside and outside the strike zone, and other indicators that helped me separate pitchers who were true strikeout arms from pitchers whose surface numbers might make them look more attractive than they really were.
But stuff alone wasn’t enough.
A pitcher can have an incredible strikeout rate and still be a bad bet to lead the slate if he’s only going to throw 75 pitches. So workload became a major part of the equation.
I built a formula to project pitch count and tried to identify pitchers who had both the swing-and-miss ability and enough expected opportunity to reach a slate-winning number.
Then came the matchup.
I looked at the opponent’s strikeout percentage for the season, but I also wanted to know what that lineup was doing right now. I incorporated strikeout rates over the previous three and five games, along with home and road splits.
AI became another tool in that process. I used it to help sort through information and identify potential targets worth investigating further. It wasn’t picking the pitchers for me. It was helping me identify where I should be looking.
Weather, pitcher metrics, workload, matchup, recent opponent performance—all of it eventually produced my list.
I had found my dudes.
Then I waited for Caesars to post the odds.
And that’s when the most important part of the handicap started.
Let the Odds Board Dictate the Bets
One of the biggest things I learned was that I didn’t need to predict the winner before seeing the odds.
I needed to identify the pool of pitchers capable of winning.
Then I could let the price determine which of them I actually wanted to bet.
As I started tracking every winner, the market began telling me what a winning performance actually looked like.
In June, the average Strikeout Leader finished with 10.10 strikeouts.
July: 10.44.
August: 10.10.
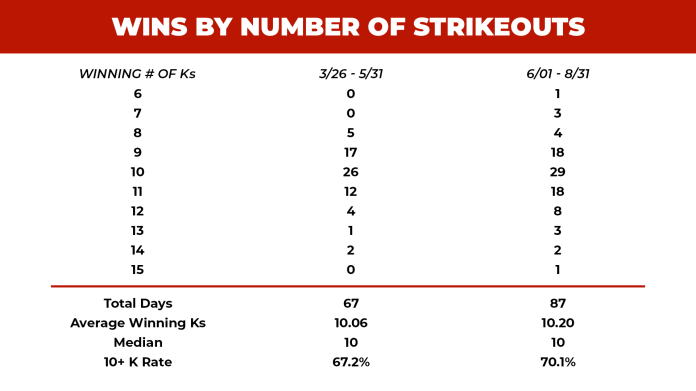
Across the entire 87-day tracking period, the average winning performance was approximately 10.20 strikeouts.
The median was exactly 10.
And 10 wasn’t just the average or median. It was also the most common winning number.
The winning total was exactly 10 strikeouts on 29 of 87 days. Another 18 were won with 11 and eight more with 12.
Overall, 61 of those 87 days—70.1%—required at least 10 strikeouts to win.
Suddenly, I had a target.
When I built my list each morning, I wasn’t asking whether a pitcher could get six strikeouts.
I was asking:
Can this guy get me 10?
And if I thought the answer was yes, what price was Caesars willing to give me?
So I Looked Back
A few weeks into betting Strikeout Leader, I wanted a bigger sample.
I had only discovered the market around the beginning of June, so I didn’t have historical odds from earlier in the season. But I didn’t need the odds to figure out who would have won.
Sometime in mid-to-late June, I went back and reconstructed the daily strikeout leader for every game day from March 26 through the end of May.
That gave me another 67 days of results from before I had ever bet the market.
The numbers were almost identical.
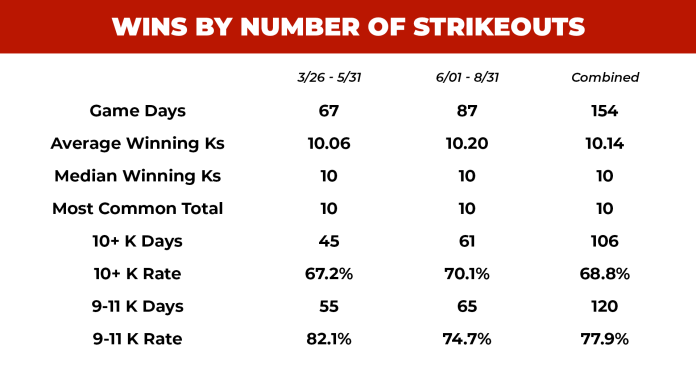
From March 26 through May 31, the average winning total was 10.06 strikeouts.
The median was 10.
The most common winning total was 10.
And 45 of 67 slates—67.2%—required at least 10 strikeouts.
Compare that with the 87 days I tracked from June through August: a 10.20 average, a median of 10, a mode of 10, and 70.1% requiring double digits.
Two different samples from two different parts of the season kept pointing toward the same answer.
Combined, that’s 154 MLB game days.
The average winning performance across all 154 was 10.14 strikeouts.
The median was 10.
The most common result was 10.
And 106 of 154 days—68.8%—required at least 10 strikeouts to win.
Even more striking, 85 of the 154 slates—55.2%—were won with either exactly 10 or 11 strikeouts.
The range could get wild. There were winning performances as low as six and as high as 15.
But the center of the market kept pulling me back to the same place.
Ten.
That became the number I was trying to find every day.
The Favorite Usually Wasn’t the Answer
Knowing what number I was chasing was only half the equation.
I still needed the right price.
The average shortest-priced pitcher on the board throughout the summer was around +430.
You might assume that consistently identifying the favorite would get you reasonably close to solving this market.
It didn’t.
Entering the final two days of August, the shortest-priced pitcher on the board had won outright just 13 times in 85 opportunities.
That’s a 15.3% outright win rate.
There were another nine occasions when the shortest-priced pitcher was part of a dead heat. Even including those, the favorite appeared in the winning group only 22 times, or 25.9% of the 85 slates.
When the favorite did win outright, there was at least some signal in the price. Those winning favorites averaged about +380, compared with +430 for the typical daily favorite.
But this wasn’t a market I wanted to attack by blindly betting the most obvious strikeout pitcher every day.
The winning prices told a very different story.
In June, the average recorded winning price was +1367.
In July, it was +1209.
August finished at +1215.
But that final August number doesn’t tell the whole story.
Through August 29, the month’s average winning price had fallen to +1055. Then Max Scherzer struck out 10 and won outright at +6000 on August 30.
One 60-to-1 winner completely changed the picture.
If anything, it was another reminder of how careful I had to be drawing conclusions from averages in a market with prices this long.
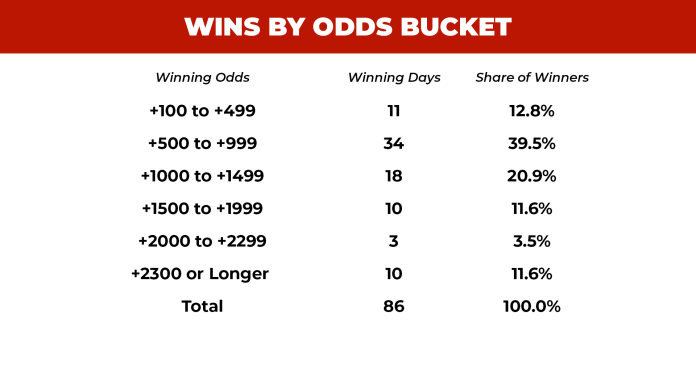
There were plenty of winners sitting in the middle of the board.
That’s what made the market so attractive to me.
I wasn’t trying to find the safest pitcher.
I was trying to find a mispriced ceiling.
I Was Buying Too Many Insurance Policies
There was another problem I had to solve, and it had nothing to do with handicapping pitchers.
It was how I bet them.
I established one rule from the beginning: I would never risk more than four units per day on this market.
Early on, however, there were days when I spread those four units across as many as 10 pitchers at 0.4 units apiece.
I thought I was protecting myself.
In reality, I was buying insurance policies.
I’d identify the pitchers I really liked, then start looking at the rest of the board.
What if this guy wins?
What if I leave him off?
What if my handicap was right about him and I don’t have a ticket?
So I’d add another 0.4 units.
And another.
After two or three weeks, I realized what I was doing.
I wasn’t adding these pitchers because I thought they were among the best bets on the board. I was adding them because I was afraid of losing without them.
So I changed the strategy.
Instead of spreading four units across eight or 10 pitchers, my standard card became 1 unit on four pitchers.
There was still some flexibility. Maybe I’d put 1.5 units on one pitcher and only 0.5 on another.
But never more than four total.
And something interesting happened.
My percentage of days finding the winner didn’t really change. My money did.
The handicapping had been working.
I just wasn’t maximizing it.
I stopped throwing away pieces of my four-unit bankroll on “what if” covers and started putting more of that money behind my best opinions.
That became one of my biggest lessons of the summer:
Finding value and extracting value from it are two different skills.
The handicapping wasn’t the problem.
The portfolio construction was.
The Market Wasn’t As Random As It Looked
Strikeout Leader can look completely insane when you first open the board.
There are pitchers at 20/1, 30/1, 40/1, 50/1 and beyond.
And yes, sometimes one of them wins.
But after tracking every result, I started realizing the market had boundaries.
Across the 87-day tracking period, 77 of the 87 slates were won by at least one pitcher priced shorter than 23/1.
Then I looked closer at the 10 exceptions.
Three were dead heats where another pitcher involved in the tie was priced shorter than 12/1.
Three more were Bryce Miller, Sean Burke and Joey Cantillo—three pitchers I believed were severely mispriced.
That left four.
Four results all summer where my analysis was basically:
What the hell was that?
The final one came on August 30.
Max Scherzer struck out 10 and won the market outright at +6000.
Sixty-to-one.
And maybe the most fitting part was the number he needed to get there.
Ten.
There was only one day all summer when every pitcher on the board was 10/1 or longer. On August 7, not a single pitcher was priced shorter than +1000.
Payton Tolle won that day with 14 strikeouts at +1200.
But those days were the exceptions, and that changed the way I viewed the board.
There might be dozens of names listed every morning, but I didn’t need to solve for all of them.
There appeared to be a much smaller universe of pitchers who realistically won this market.
And the repeat winners reinforced that.
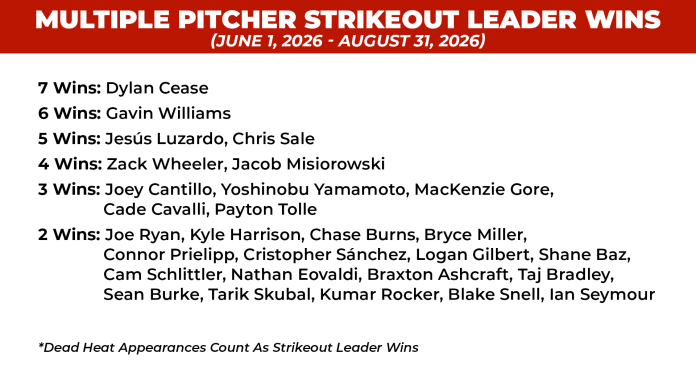
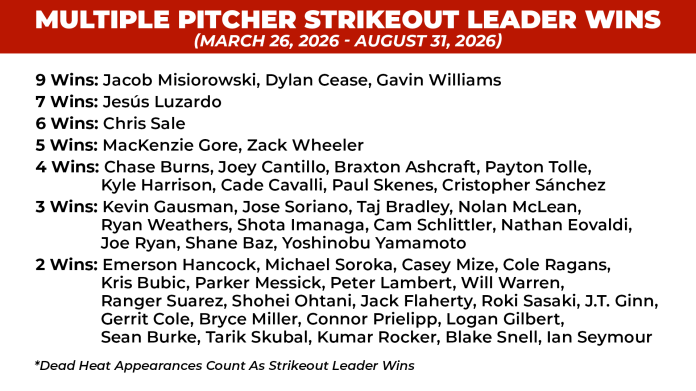
Dylan Cease appeared in the winning group seven times.
Gavin Williams did it six times.
Jesús Luzardo and Chris Sale each did it five times.
Zack Wheeler and Jacob Misiorowski each appeared four times, with several more pitchers showing up repeatedly.
By the end of the summer, only 60 different pitchers had appeared in the winning group across the 87 tracked slates.
I wasn’t searching for a completely different needle in a haystack every night.
The same types of pitchers—and often the exact same pitchers—kept coming back.
The Market Started Learning, Too
There was one catch.
While I was learning the market, the market was learning too.
Dylan Cease was one of the clearest examples.
When Cease won on June 9, he was +750.
July 8? +500
When he won again on August 16? +350.
Sean Burke was even more dramatic.
Burke won at +2500 on July 4.
Twenty-six days later, on July 30, he won again.
This time he was +350.
Cade Cavalli won at +3000 on June 30.
By the time he won again on August 19, he was +1200.
The target wasn’t moving very much. The price was.
That alone doesn’t prove the market became more efficient. There’s plenty of variance in a sample this size.
But I didn’t need a spreadsheet to tell me what I could see on the board.
Pitchers who had repeatedly demonstrated Strikeout Leader-type ceilings weren’t hiding at the same prices anymore.
The sportsbook was adjusting.
That introduced another question into my handicap.
It wasn’t enough to identify a pitcher who could win.
At what price did I no longer want to bet him?
From Six Strikeouts to Fifteen
For all the patterns I found, baseball still found plenty of ways to remind me that this was baseball.
The highest strikeout total required to win during the summer came from Jacob Misiorowski, who struck out 15 on June 12 at +300.
Misiorowski also produced the shortest-priced outright winner I tracked when he won at just +125 on July 2.
At the opposite extreme, Christian Scott won the entire market with only six strikeouts on June 11 at +750.
For most of the summer, the highest-priced outright winners were Bryce Miller on June 6 and Kyle Freeland on July 11.
Both were +3300.
Then, with two days left in the experiment, Max Scherzer blew past both of them with his +6000 outright win on August 30.
The longest-priced dead-heat winner came on July 3, when Ryan Feltner was part of a three-way tie at +5000.
The average might tell me I’m looking for 10 strikeouts.
Baseball occasionally has other plans.
Ties Aren’t Rare
Dead heats also became a much bigger part of the market than I initially expected.
Over the 87-day summer tracking period, 19 days ended in some form of dead heat.
That’s 21.8% of the slates.
Sixteen were two-way ties.
Two were three-way ties.
And one slate somehow ended in a five-way tie.
When I went backward to March through May, the same pattern was sitting there too.
Seventeen of those 67 days ended in ties.
Combine the two samples and 36 of 154 game days—23.4%—ended with multiple pitchers sharing the strikeout lead.
Nearly one out of every four days.
Dead heats aren’t just a statistical curiosity when you’re betting this market. They change the payout, and they can turn the feeling of finding the Strikeout Leader into something considerably less exciting when you realize you’re sharing it with two, three or sometimes four other pitchers.
But there was another side to that.
A few times during the summer, I actually had both pitchers involved in the dead heat.
Those were some of the more satisfying wins because instead of watching another pitcher come along and cut into the payout on my winning ticket, I got to look at my card and realize:
I had him too.
And because I had multiple winning tickets getting reduced by the dead-heat rules, the combined payout could end up pretty similar to what I would have won if either pitcher had taken the title outright.
There is something especially satisfying about spending all day trying to identify the handful of pitchers capable of leading the slate and finishing the night having picked multiple Strikeout Leaders.
So I learned not to look at ties as automatically good or bad.
If I only had one side, I obviously wanted him to win outright.
If I had both? Chop away.
And Then There Is the Sweat
There is one part of this market that none of these numbers really capture.
It’s ridiculously fun to sweat.
On a full slate with afternoon games and late West Coast starts, your bet can last all day.
One of my favorite versions of the sweat came on June 10.
Drew Rasmussen pitched early, struck out 13, and I had him at +2000.
There was nothing better than having 13 in my pocket that early in the day.
Every pitcher who took the mound after him needed a monster performance just to threaten me.
For the rest of the slate, I wasn’t chasing anybody.
Come get me.
Of course, it doesn’t always work that way.
Maybe one of your pitchers gets to 10 in an early game. Now you have to sit there for the next eight hours and defend 10.
Every starter becomes a threat.
Someone has six strikeouts through three innings.
Someone else suddenly gets to eight in the fifth.
A pitcher with nine gets sent back out for the seventh, and now you’re watching every two-strike count hoping somebody just puts the ball in play.
Or maybe your early guys don’t get there at all and you’re waiting until 10 p.m. for your last ticket of the night to even take the mound.
I’ve spent entire days following one number from the afternoon games through the late West Coast starts.
Every strikeout changes what the pitchers coming later need to chase.
And people say baseball is boring.
What I Actually Did
Of course, studying a market is only interesting up to a point.
Eventually, the bets have to win.
Over the three months I bet Strikeout Leader, I had the winner on 61 days – a 70.1% win rate – for +168.65 units.
June: 24-6, +31.1 units.
July: 21-6, +84.05 units.
August: 16-14, +53.5 units.
That monthly breakdown might be the best example of why I had to change the way I thought about this market.
I won 80% of my days in June and made 31.1 units. In August, I won only 53.3% of my days and made 53.5 units.
In a market with prices like these, finding the winner mattered.
But so did what I was getting paid when I found him.
My longest winning streak lasted 13 days, from July 18 through July 30.
My longest-priced personal winner was Bryce Miller at +3300 on June 6.
Three times, I managed to have both sides of a dead heat in my pocket.
On June 26, I had Joey Cantillo at +2500 and Nathan Eovaldi at +2800.
On July 29, I had Chris Sale at +700 and MacKenzie Gore at +1800.
And on August 13, I had Braxton Ashcraft at +800 and Cade Cavalli at +1200.
There were also five days when I didn’t need four pitchers—or even two.
I made exactly one Strikeout Leader bet, and that pitcher won outright.
MacKenzie Gore at +800 on June 15.
Taj Bradley at +1400 on July 1.
Zack Wheeler at +700 on July 7.
Hunter Greene at +800 on July 10.
And MacKenzie Gore again at +700 on August 10.
One pitcher. One ticket. One winner.
I did spend a small piece of the winnings on myself.
As a Philadelphia sports fan, I bought replica Lombardi Trophies from both Eagles Super Bowl wins and a replica of the Phillies’ 2008 World Series trophy.
Which means my little collection of Philadelphia championship trophies was, in part, funded by pitcher strikeouts.
I think that’s a perfectly reasonable use of gambling winnings.
But the part I’m most proud of isn’t any individual longshot ticket—or what I bought with the winnings.
It’s that the results came from a process that changed throughout the summer.
I didn’t discover Strikeout Leader with a perfect system.
I started with five years of pitcher strikeout handicapping experience and adapted it to a market I had barely thought about before.
Then I tracked everything.
Within a few weeks, I had gone backward and reconstructed the first two months of the season because I wanted to understand what winning this market actually looked like.
I learned what number typically won.
I learned what prices typically won.
I learned which pitchers repeatedly showed the ceiling required to win.
I learned that the favorite wasn’t nearly as dominant as I might have assumed.
I learned that extreme longshots could win, but that I didn’t need to insure myself against every one of them.
I learned to stop spreading my money across every pitcher who scared me and put more of it behind the pitchers I actually believed in.
And eventually, the market started learning some of the same things.
So, What Did I Learn?
If I had to summarize an entire summer of betting this market into one idea, it would be this:
I’m not trying to pick the pitcher most likely to record a lot of strikeouts. I’m trying to identify the pitchers capable of recording the most strikeouts—and then find the price that makes being right worthwhile.
Those aren’t the same thing.
Across the 154 game days I studied from March 26 through the end of August, the average winning performance was 10.14 strikeouts.
The median was 10.
The most common winning total was 10.
And 68.8% of those days required double digits.
I spent five years studying strikeout ceilings, swing-and-miss ability, matchups and workload to decide whether somebody could clear a traditional K prop.
Then I stumbled across Strikeout Leader and started telling the small group of people I trusted enough to talk about it with that this market was about one thing:
FINDING DUDES.
Find the pitchers with the stuff.
Find the workload.
Find the matchup.
Find the ceiling.
Then look at the board and decide whether the price is worth betting.
For years, I thought I was preparing to answer one question.
Maybe I had been preparing for a different one all along.
Not:
Will this pitcher go over 5.5 strikeouts?
But:
Can he get to 10 tonight?
If I believe he can, there’s only one question left.
What’s the price?
Data note: MLB’s three-day All-Star break produced no slates, and Caesars did not post Strikeout Leader odds for the standalone game immediately following the break. I was traveling for PrimeTime’s Hawaii broadcasts on August 24 and didn’t record the odds that day, while Caesars did not post the market on August 28. That leaves 87 Strikeout Leader outcomes during the June 1 through August 31 tracking period, with winning odds recorded for 86 of them.